
Reporting & dashboards
Asset reports for the job in front of you
Check what equipment is allocated, review calculated asset values or find completed forms. Start with the right report, then open the records and settings behind the result.
Get pricing
Read how these teams run MapTrack









Co-Founder & GM of Operations
From the report to the records behind it
- Equipment use
- allocations & Requests
- Asset values
- configured depreciation
- Form activity
- completion & submissions
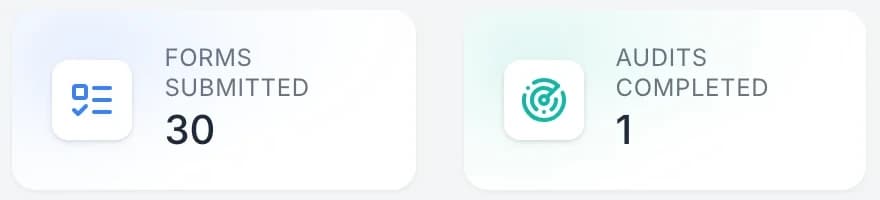
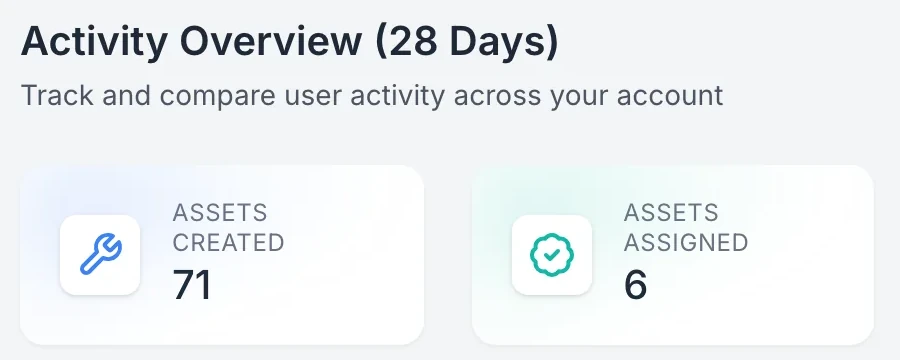
Activity Feed and Team Leaderboard show recorded activity.
MapTrack app · Demonstration data · Captured
Choose the report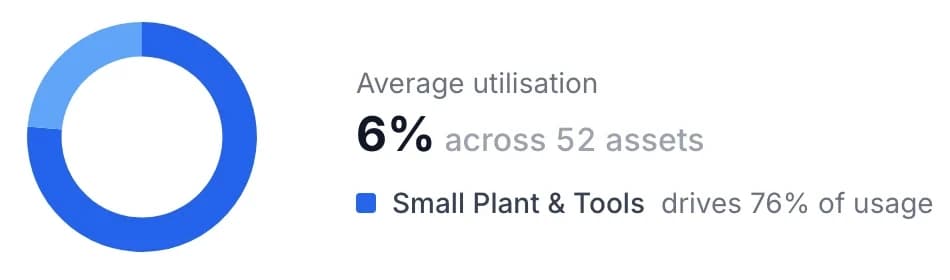
Open Reports > Asset Performance. Choose a period and asset group, then inspect recorded allocated time and forward Requests.
MapTrack app · Demonstration data · Captured
Inspect the period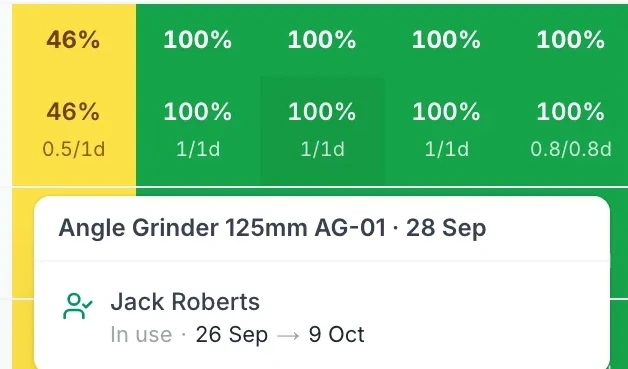
Inspect usage and Requests for that asset and period.
MapTrack app · Demonstration data · Captured
Open a cell
Read the purchase fields, useful life and residual value beside the depreciation result.
MapTrack app · Demonstration data · Captured
Check the value inputs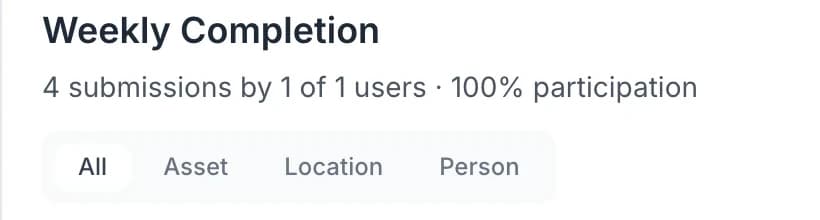
Open Forms > Reporting for weekly completion and submission activity.
MapTrack app · Demonstration data · Captured
Find completed forms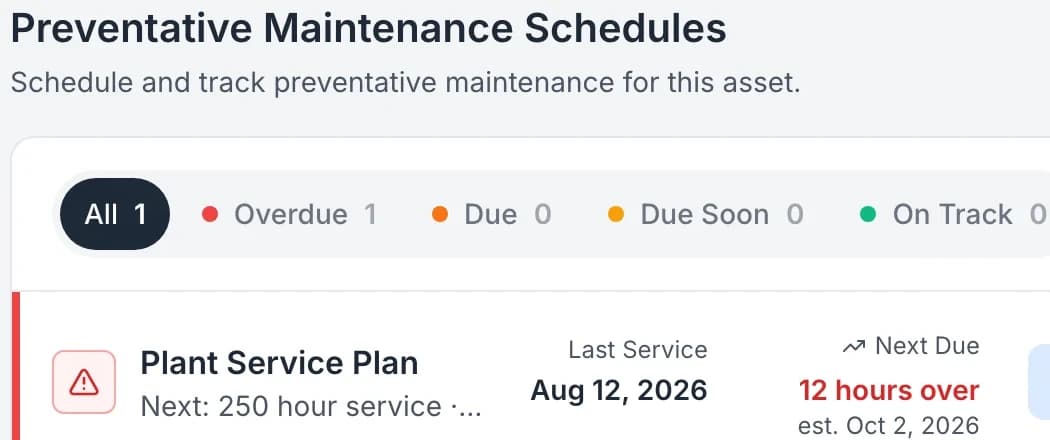
Inspect the next service on the Service Board and the saved notes, files and forms in asset service history.
MapTrack app · Demonstration data · Captured
Review the service history
Choose the report that answers your question
The equipment coordinator, the finance team and the person following up a missing form need different records. These are the places to start.
1. Check what is allocated or requested
Open Reports > Asset Performance. Choose a period and asset group, then inspect recorded allocated time and forward Requests. Use the heatmap and cell detail to investigate a quiet or busy period.
2. Review calculated asset values
Open Reports > Asset Depreciation. Map the purchase date and price fields, choose the method and currency, and check the useful-life and residual-value settings before generating the report.
3. Find completed forms
Open Forms > Reporting for weekly completion and submission activity. Check the people and period, then read the saved answers when you need evidence of a particular check.
4. Follow servicing and team activity
Use Asset Servicing for service information, then the Service Board and asset history for the next due service and saved work. Activity Feed and Team Leaderboard help review the actions recorded by the team.
Setup and limits
- Reports need a connection. Access and available actions depend on the report and your permissions.
- Allocated time, calculated book value and form completion each measure something different. Check the records before deciding what to do next.
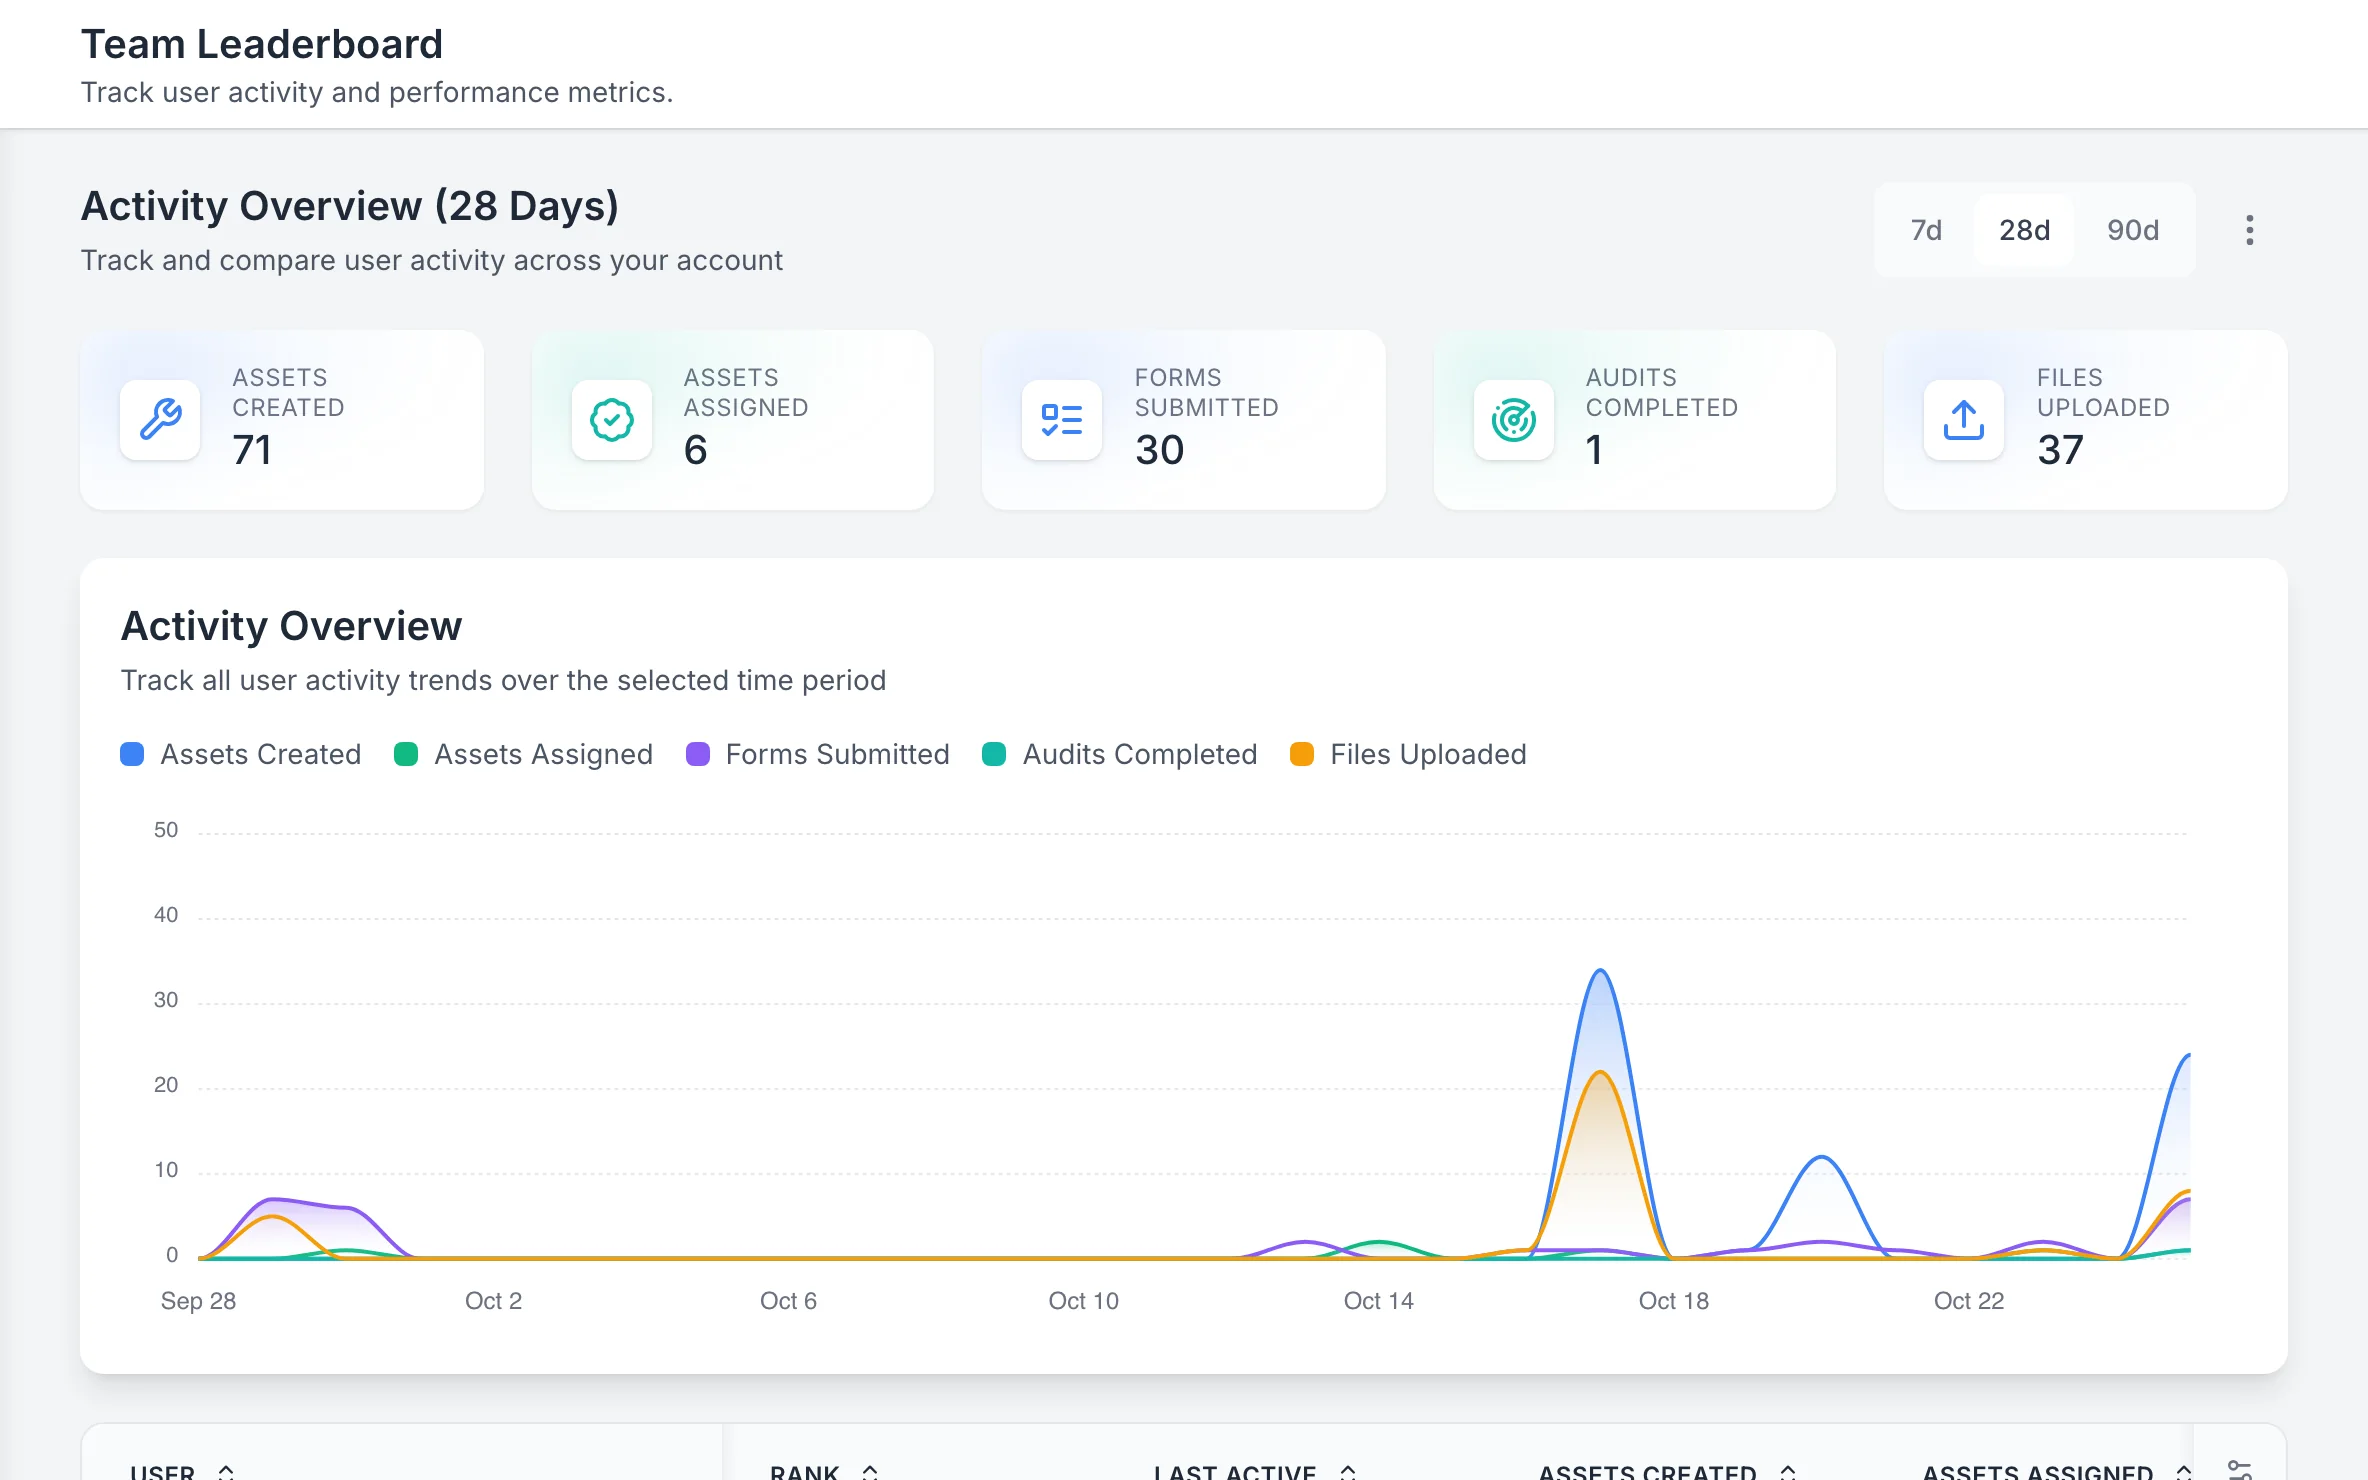
Team activity over the last 28 days
The leaderboard totals what the team did over the period, assets created, assigned, forms, audits and files, and charts it day by day.
MapTrack app · Demonstration data · Captured
About this screenshot
Captured at a 1440 x 900 desktop viewport at 2x in a demonstration workspace, right of the sidebar.
Trusted by construction, civil and mining teams









Inspect the period behind the percentage
Before hiring more equipment or moving it between jobs, check what the report includes. A coloured heatmap cell is useful when you can explain the recorded time and Requests behind it.
1. Choose the equipment and dates
Set the date range and scale, then filter by category, current location or utilisation band. Check the assets included before comparing groups or reading a ranked panel as a whole-fleet result.
2. Open a cell and review the record
Inspect usage and Requests for that asset and period. Check a quiet patch against allocation history and speak with the crew before concluding the equipment was unused.
3. Keep context with the export
Export Asset Performance when you need a working file. Keep the date range and selected assets with it so another person can understand the comparison.
Setup and limits
- Allocated time does not establish engine hours or productive output. Requested equipment is planning context.
- The location filter uses the asset’s current saved location. Historical time on site comes from the relevant configured MapTrack Telematics report.
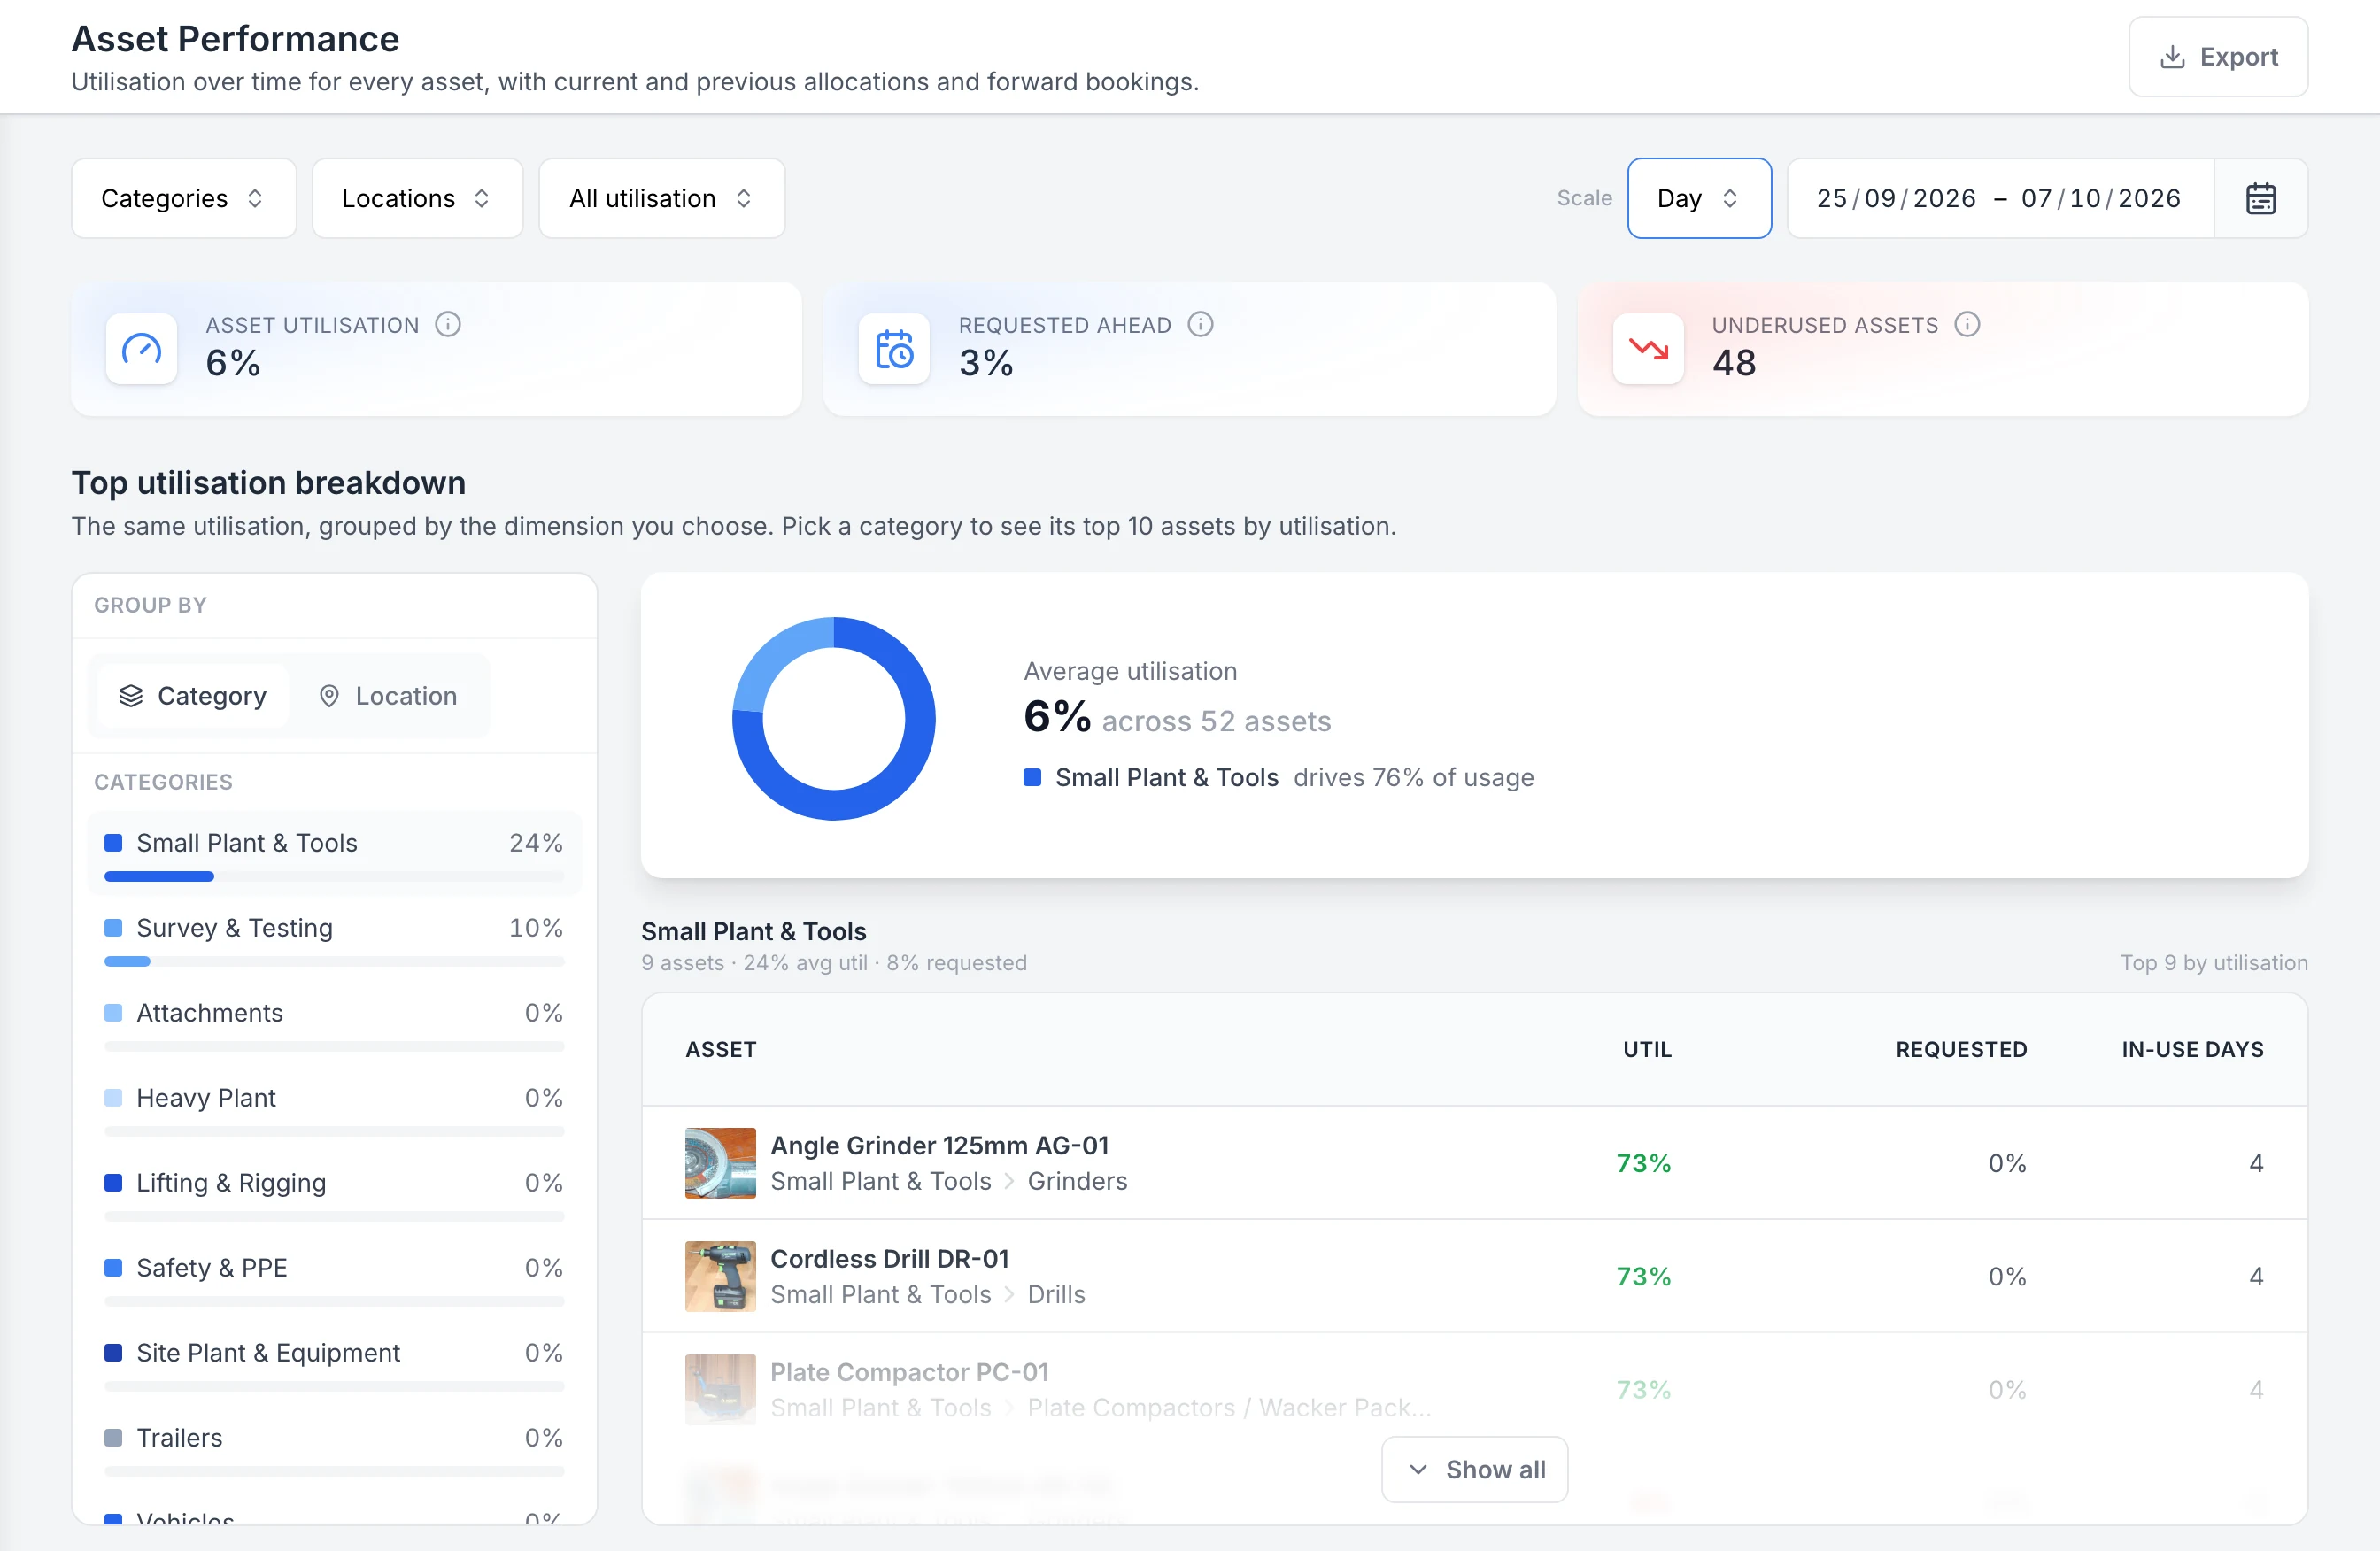
Compare recorded equipment use over a chosen period
Set the date range before comparing the summary and category breakdown. Recorded allocations drive utilisation; future requests appear separately. The selected group contains nine assets in this example.
MapTrack app · Demonstration data · Captured
About this screenshot
Demonstration assignments and requests, viewed on 30 September. These percentages describe recorded allocations, not measured engine hours or productive work.
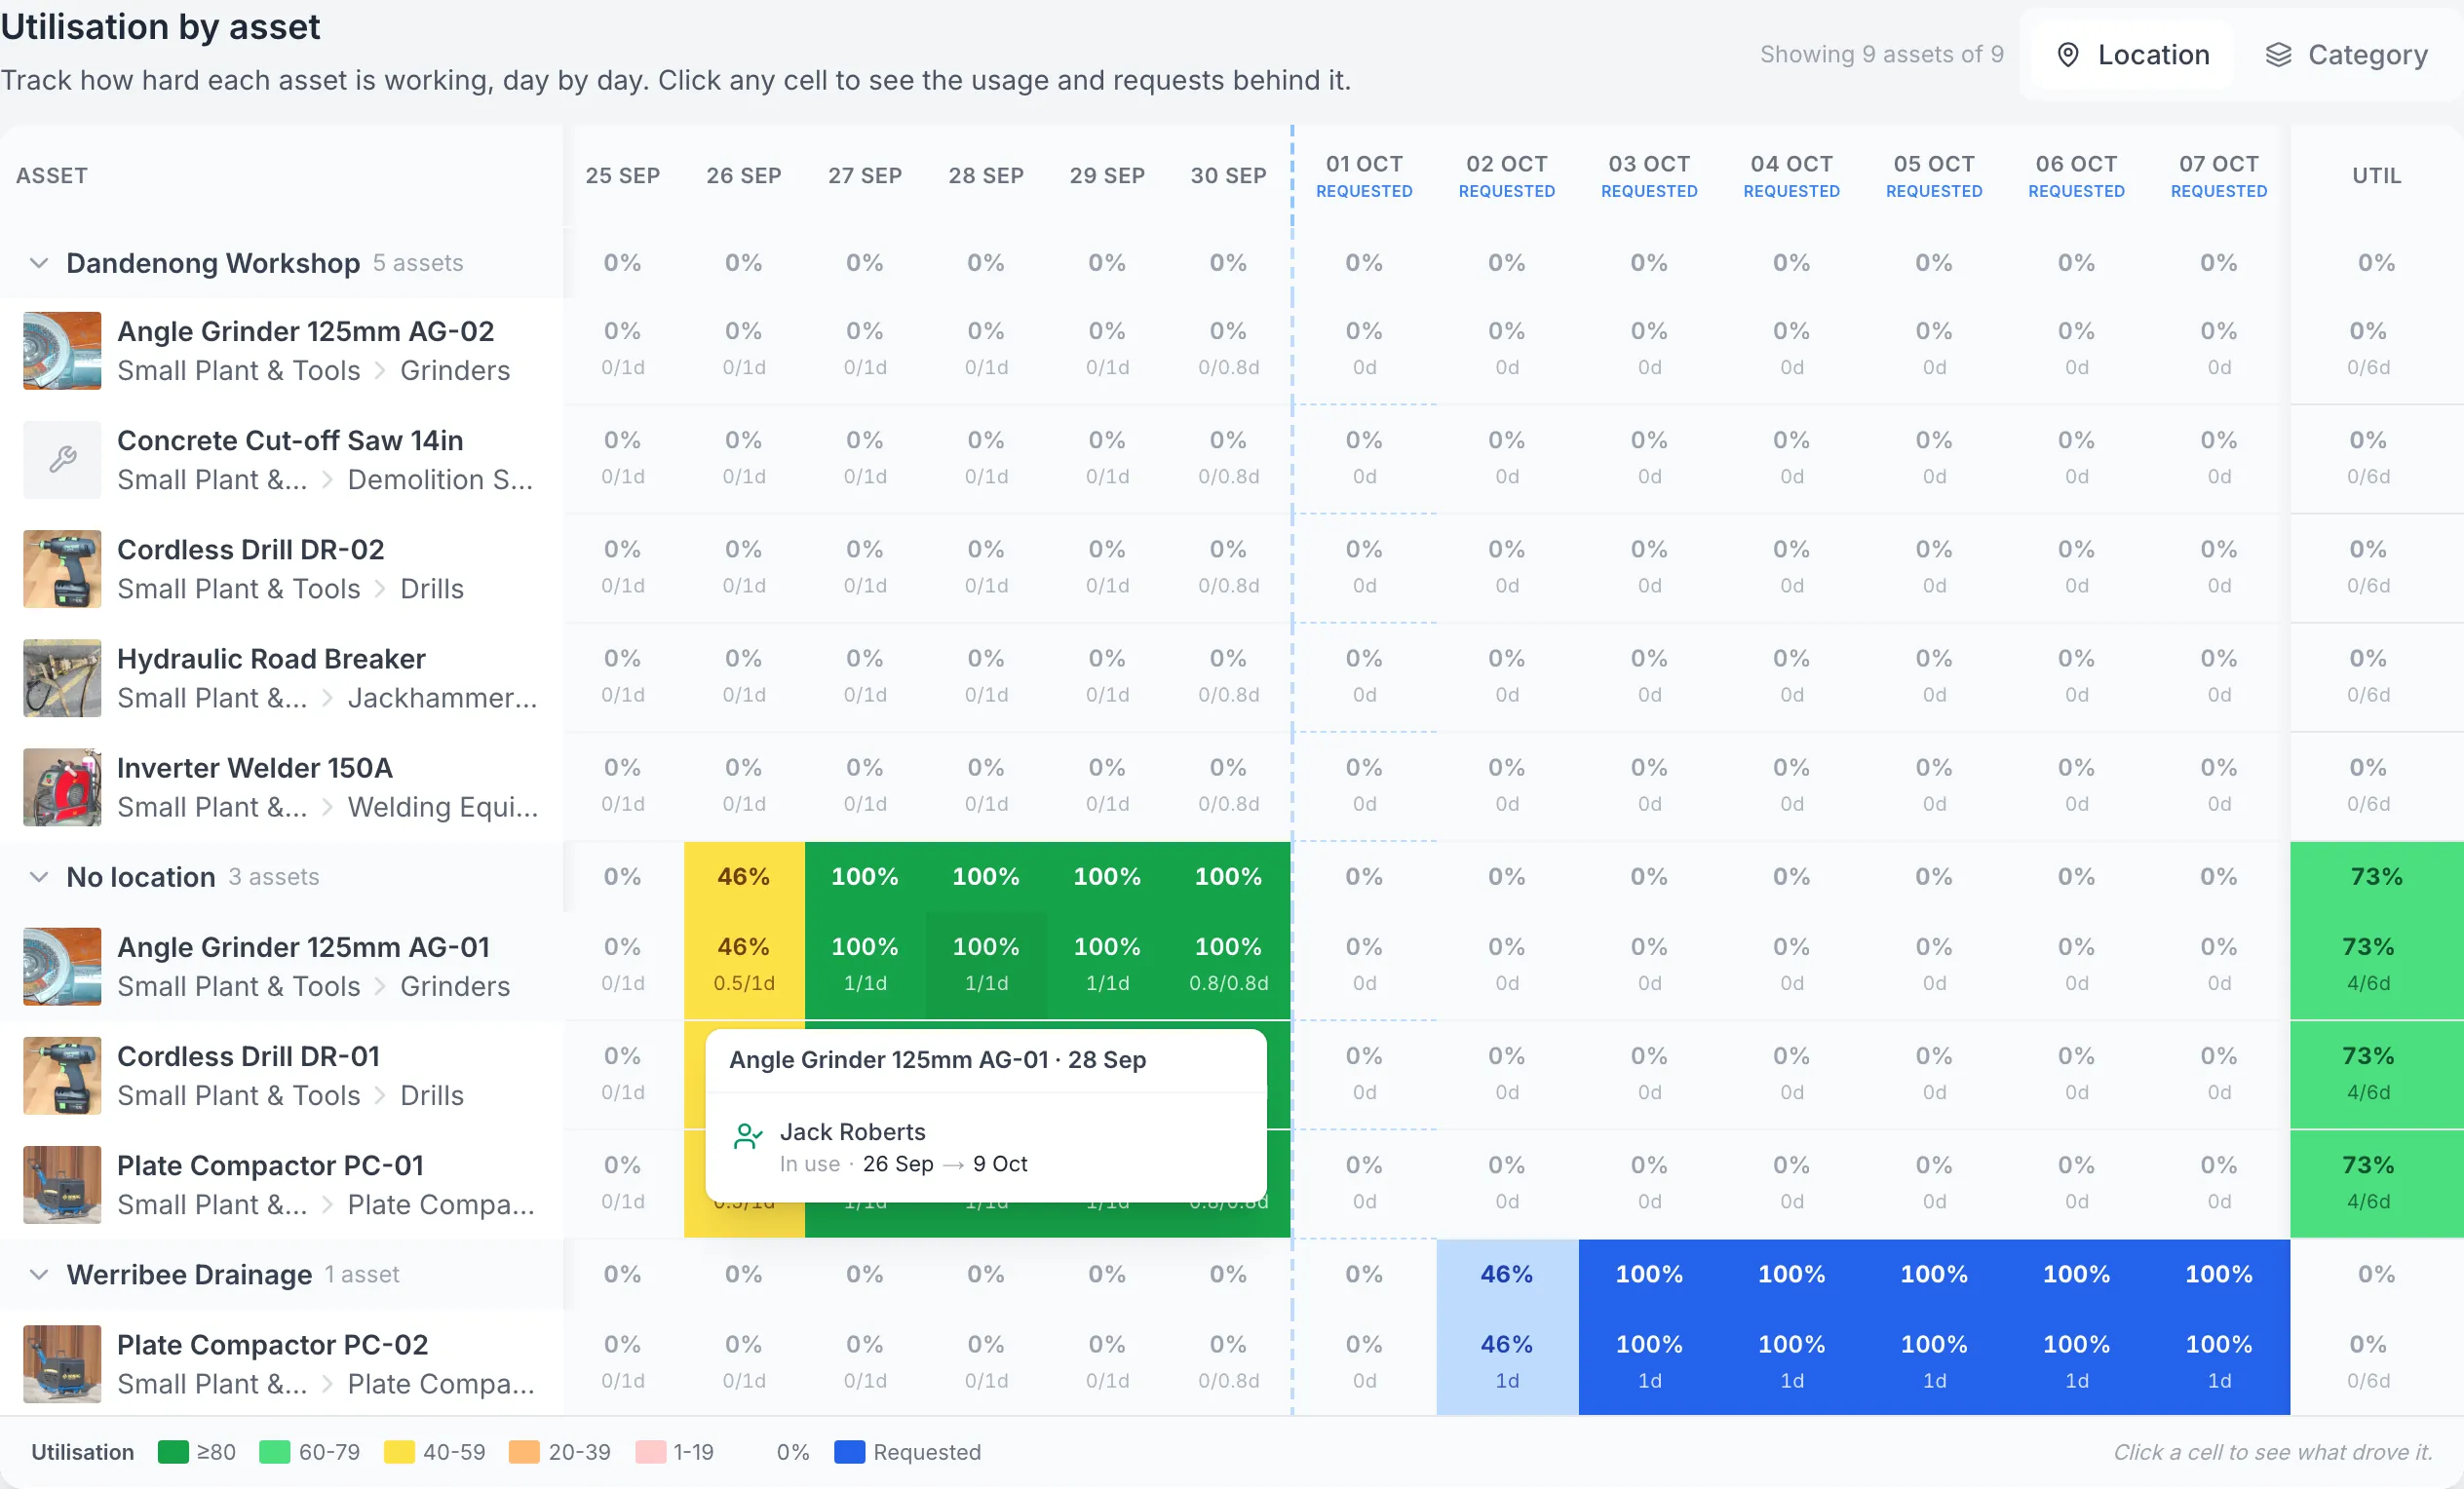
Open the allocation behind a coloured cell
Opening the grinder’s 28 September cell reveals the recorded allocation and its dates. Green allocation time and blue requested time answer different questions; neither proves that the equipment was running.
MapTrack app · Demonstration data · Captured
About this screenshot
Demonstration Small Plant & Tools filter, 25 September to 7 October 2026. Location groups use each asset’s current saved location. The No location group does not mean the equipment has no physical whereabouts.
Follow the result to the next record
A summary helps you find the next item to review. The settings, saved answers and service record explain what happened.
Check the value inputs
Read the purchase fields, useful life and residual value beside the depreciation result. Calculated book value does not tell you the current sale price or physical condition.
Explore asset depreciationOpen the completed form
Read the actual answers and available attachments. Participation and completed-day rates describe recorded activity; check the submission when you need the result of an inspection.
Find the saved submissionReview the service history
Inspect the next service on the Service Board and the saved notes, files and forms in asset service history. A due service and completed work are separate records.
Review service history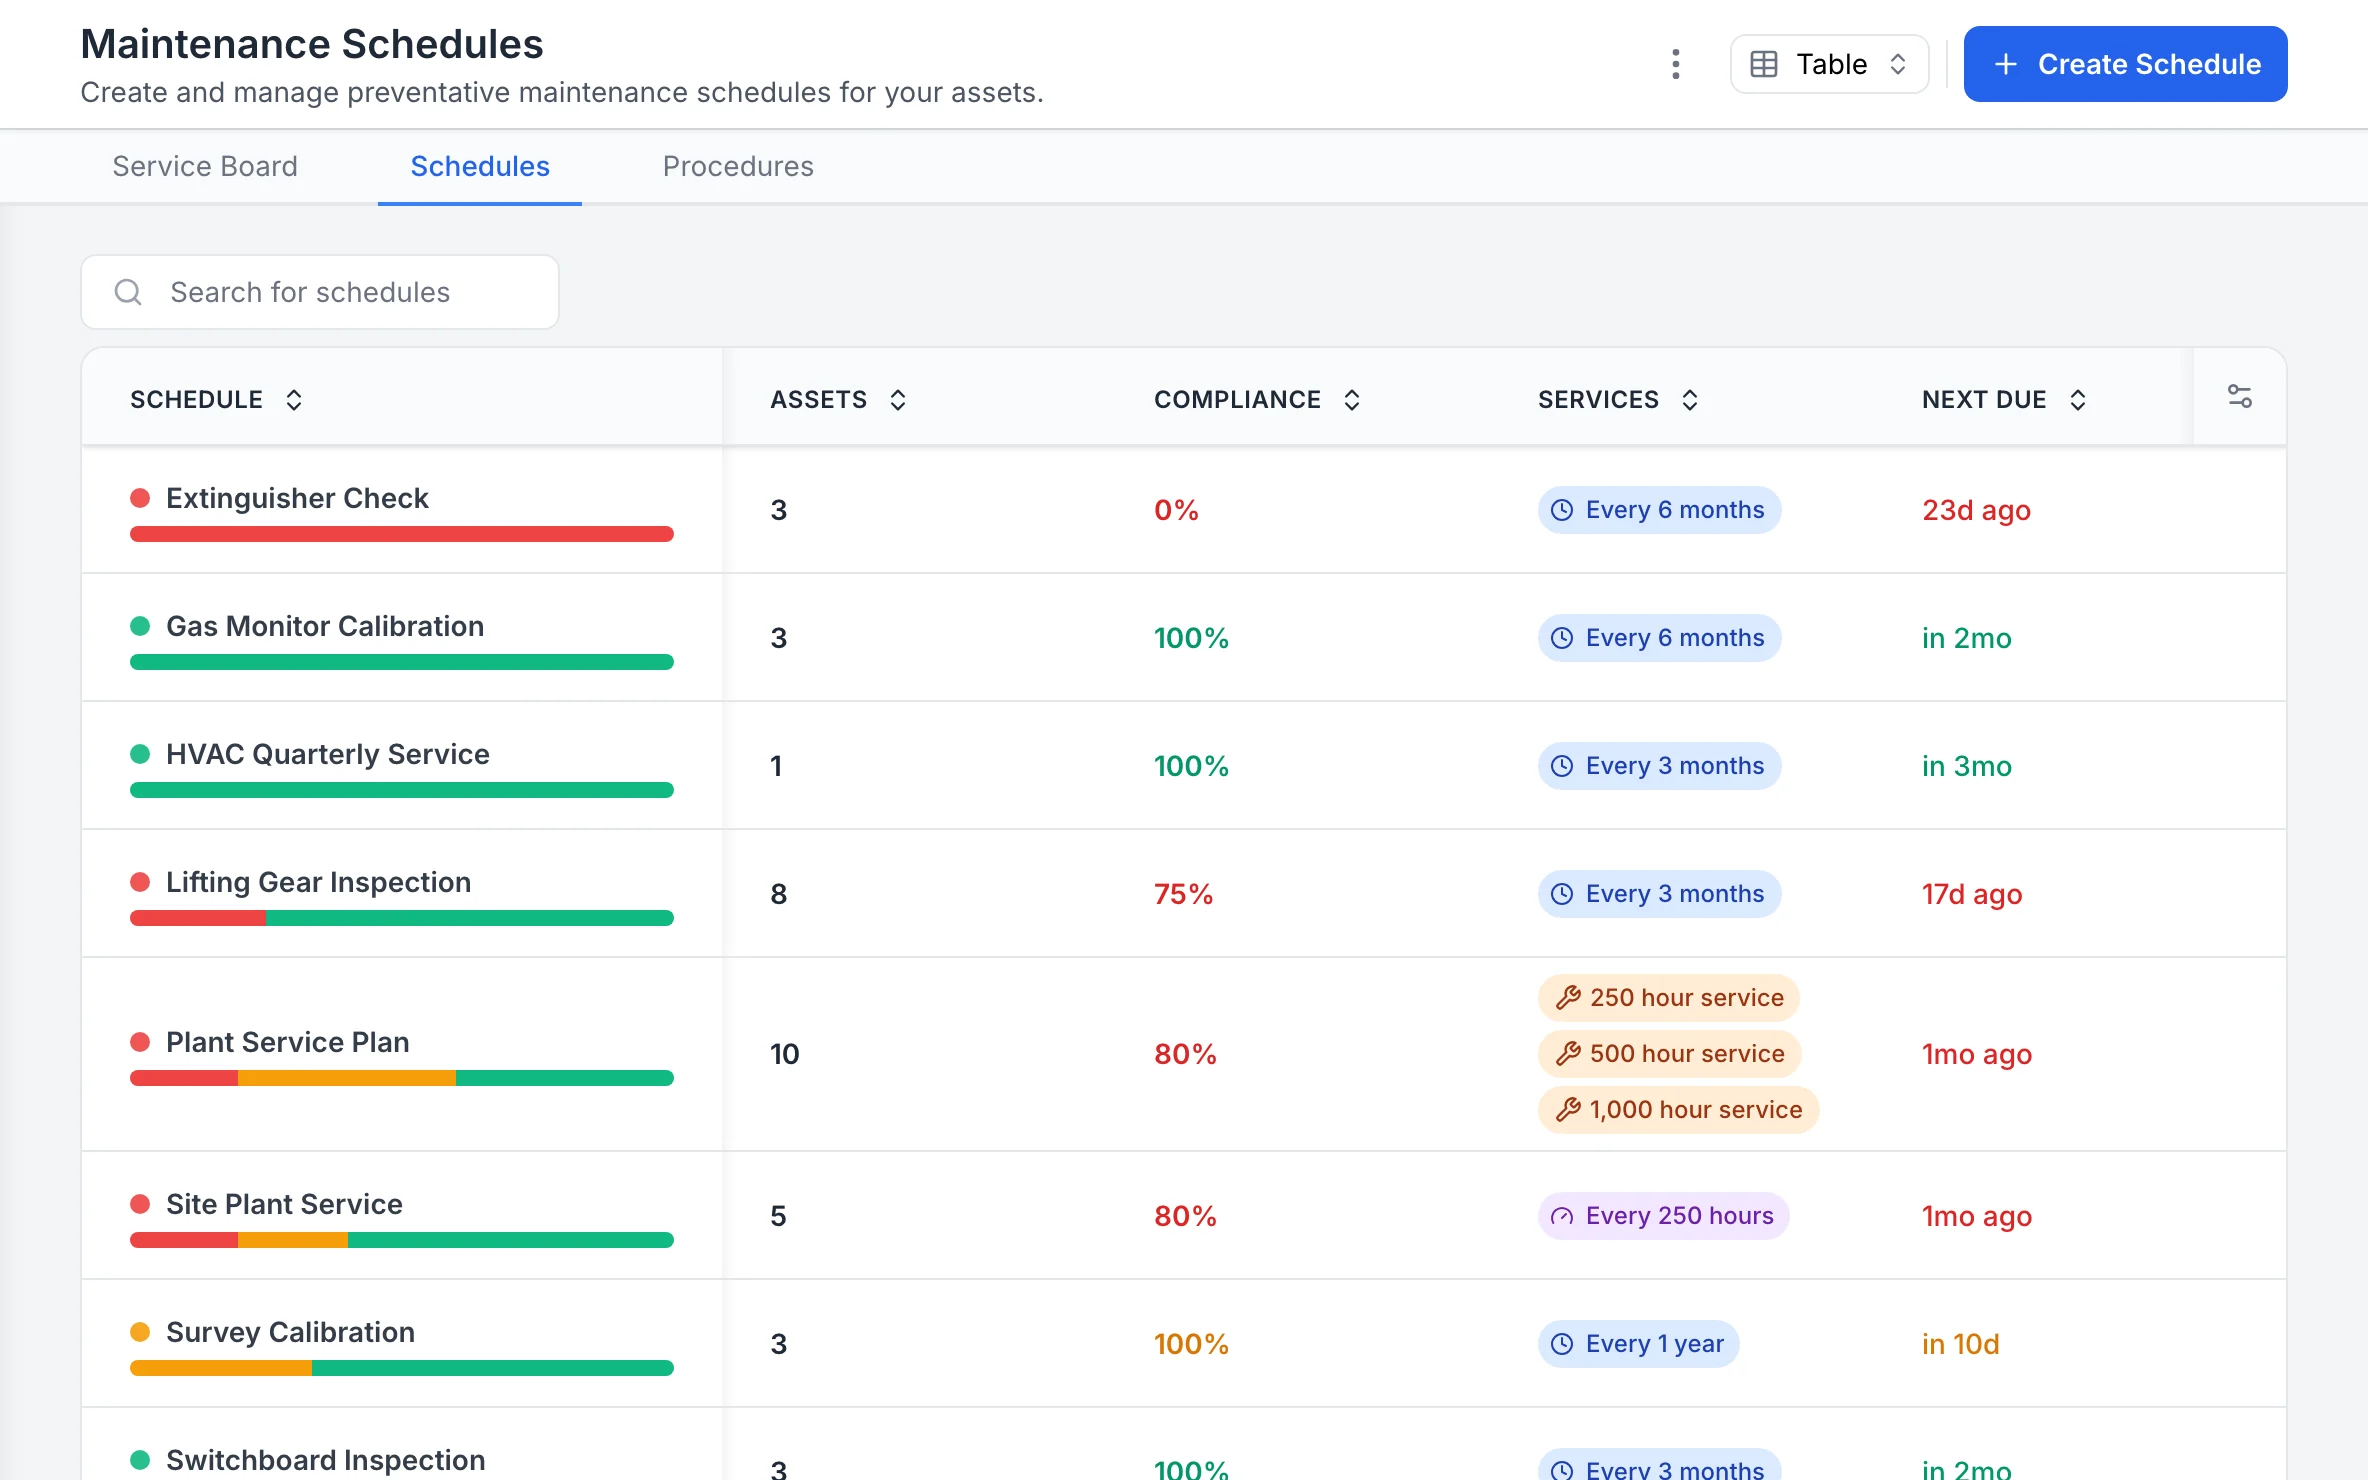
Every maintenance schedule, with how it is tracking
Each schedule shows how many assets it covers, its compliance, its interval in time or hours, and when it is next due.
MapTrack app · Demonstration data · Captured
About this screenshot
Captured at a 1440 x 900 desktop viewport at 2x in a demonstration workspace, right of the sidebar.
Bring your reporting question to the demo
Start with the equipment, period and decision you need to make. We can walk through the report and the records behind it with your team. Try MapTrack free.
- No credit card required
- Unlimited users
Resources to improve your reporting
Frequently asked questions
Reports that answer the right questions
Join teams using MapTrack for asset and operational reporting.
- No credit card required
- Unlimited users
Related definitions
Key terms explained in our glossary