















Water Utilities

Water utility asset management software for pump stations

Track pump stations, treatment plants, distribution networks and field instruments across every catchment. AS/NZS 5667 sampling, calibration records and runtime-based maintenance in one platform built for Australian water authorities.

From $1 a tool and $12 a machine a month, AUD ex GST. Unlimited users.

600,000+ assets tracked since 2012 · Unlimited users, every operator and crew · Offline-ready, works at remote pump stations

A bank of water meters and valves on a wall, with one meter ringed, its QR label marked and the last service and next due date from a MapTrack schedule laid beside it.
Next service due
MapTrack maintenance schedule: last service 20 Oct 2026, next due 20 Jan 2027, with Record service.
QR labelExample: scan to open its record
Next service due
MapTrack maintenance schedule: last service 20 Oct 2026, next due 20 Jan 2027, with Record service.
QR labelExample: scan to open its record

Asset tracking software for water utilities helps networks and field crews manage chlorine analysers, gas detectors, pumps, generators and sampling assets across catchments from one register. MapTrack combines QR scanning and GPS with offline mobile capture for reservoirs, bores and outlying pump stations, calibration certificates and next-due dates, geotagged sampling evidence and runtime-based servicing. Water teams use it to meet AS/NZS 5667 chain-of-custody and Drinking Water Quality Management Framework expectations, keep analysers and field probes in calibration, and act on logged condition issues before they cause unplanned outages. The Bureau of Meteorology puts the average unplanned interruption to drinking water supply at 118.3 minutes for the median Australian utility in 2024-25.

Key takeaways

  • ABB’s 2023 Value of Reliability survey puts unplanned downtime at close to A$349,000 an hour for the typical Australian industrial business, against A$194,000 globally. Its sample includes water and wastewater operators.
  • AS/NZS 5667 sets sample collection and chain-of-custody standards; AS/NZS 4020 governs materials in contact with drinking water across the network.
  • The Drinking Water Quality Management Framework and state EPAs expect timestamped, geotagged sampling and calibration evidence on demand, not in a filing cabinet.
  • Chlorine analysers, gas detectors and field probes have mandatory calibration intervals; certificates and next-due dates belong against each asset record.
  • Centrifugal pumps, dosing pumps and standby generators wear by runtime hours, not the calendar; in ABB’s 2023 survey, whose sample includes water and wastewater, 69% of industrial businesses have an unplanned outage at least once a month.
  • Offline mobile capture is essential for reservoir inspections, bore checks and outlying pump stations where cellular coverage is patchy across the catchment.

Pricing

One price per machine, with the hardware included: software and a QR tag from $12 a machine a month, GPS tracking from $27 and AI cameras from $72. Tools and equipment start at $1/asset/month. Every plan includes unlimited users. Prices are AUD ex GST, and machine prices are for annual billing.

View pricingGet a tailored quote

Jarrod Milford

Jarrod Milford

Co-Founder & Commercial Director

Published 26 October 2026

Pump station inspection and maintenance software

Water utility field crews look after pump stations, switchboards, generators and the mobile gear that moves between remote sites. In MapTrack each pump, valve and switchboard gets a QR label and its own record, so a scan on site opens its history. Inspections run on the phone with a pass or fail and a photo of any fault, and they save with no reception and sync when crews are back in range. Generators and pumps are serviced on run hours: log the reading when you service one, and it sets when it's next due.

Water Utilities

MapTrack at a glance

Built for
Water utility field crews looking after pump stations, switchboards, generators and mobile gear at remote sites.
Tracks
Pumps and motors at pump stations, valves at treatment plants, switchboards, dosing equipment, mobile generators and pumps, hydrants used by water carts, confined-space and gas detection gear, sampling instruments.
Tracked with
QR labels or battery GPS trackers.
Works offline
Pre starts, inspections and other forms save with no reception and sync when the phone is back in range. A work order already loaded on the phone can be worked through with no reception too.
Phones and computers
In the browser on a computer, and Android, iPhone and iPad access through the mobile browser or the installable web app.
Connects to
Telematics and accounting integrations, a public API, and an MCP server for AI tools such as Claude.
Sign-in
Sign in with Microsoft, or SAML 2.0 single sign-on set up by our team (Enterprise, or a Pro add-on).
Set-up and support
24/7 support. Our team sets up single sign-on and OEM telematics feeds, and helps connect trackers you already run.
Track record
600,000+ assets tracked since 2012.

How to choose pump station inspection and maintenance software

Look for:

  1. Plant above ground registered to your own asset numbering standard
  2. Inspections on the phone with a pass or fail and a photo of any fault
  3. Forms that save with no reception and sync when crews are back in range
  4. Generators and pumps serviced on run hours
  5. Gas detectors in cal for confined-space entry

Where MapTrack fits

Next to your network asset system

If the network sits in an enterprise asset system, MapTrack can run beside it for the plant above ground, the mobile gear and the crews' inspections.

Next to telematics

A telematics platform tracks where vehicles go. MapTrack puts each vehicle and machine on the same register as the tools, with its pre starts and services. A GPS tracker or AI dashcam puts its latest position on the record, with estimated km and hours feeding its services, and MapTrack Telematics adds GPS tracking with trips, history and geofences.

See what MapTrack costs for your water utilities assets

Per-asset pricing tailored to your water utilities asset mix and a rollout plan, within one business day.

Trusted by field, plant and maintenance teams

Saunders InternationalMineral ResourcesSupagasHacer GroupMetro TunnelUltrabuilt
G2 rating 4.9 out of 5
Capterra rating 5.0 out of 5GetApp rating 5.0 out of 5Software Advice rating 5.0 out of 5
15 reviews on G2 · the same 17 reviews on Capterra, GetApp and Software AdviceCapterra Best Value 2026 badgeCapterra Best Ease of Use 2026 badgeAll MapTrack reviews

What we track

What you run, and how MapTrack tracks it

Pumps and motors at pump stations
QR label
Valves at treatment plants
QR label
Switchboards
QR label
Dosing equipment
QR label
Mobile generators
QR label and battery GPS tracker
Mobile pumps
QR label and battery GPS tracker
Hydrants used by third-party water carts
QR label
Confined-space and gas detection gear
QR label
Sampling instruments
QR label

Running a mix like this? See how MapTrack handles it in a demo built around water utilities teams.

Book a demo

30 minutes on Microsoft Teams

The challenge

The real costs of poorly managed water utility assets

Water utility assets are spread across catchments, often hundreds of kilometres apart, with strict regulatory expectations on sampling, calibration and reporting. SCADA shows you the live process, but it does not prove you serviced the dosing pump on schedule or calibrated the chlorine analyser before the EPA inspection.

Distributed pump stations and dosing sites with no single view

Pump stations, dosing systems, reservoirs and bores spread across catchments with no central asset register. Each crew runs its own spreadsheet or paper logbook. By the time a regulator asks for evidence on a specific site, finding the right inspection record takes hours.

AS/NZS 5667 sampling and calibration evidence in spreadsheets

Sample chain-of-custody, calibration certificates and field instrument records all need to stand up to EPA inspection and the Drinking Water Quality Management Framework. Spreadsheets, scanned forms and email threads are exactly what auditors find inadequate when they look closely.

Pump and plant servicing runs on calendars, not runtime

Centrifugal pumps, dosing pumps, blowers and standby generators wear based on runtime hours and operating cycles, not arbitrary monthly reminders. Missing service intervals causes unplanned shutdowns of critical infrastructure with consequences for supply, environmental discharge and customer service.

Field crews working at remote sites with no signal

Reservoir inspections, bore checks and outlying pump station visits often happen in regional areas with patchy connectivity. Paper forms get lost between truck and depot, photos do not get attached to records, and routine inspections turn into a back-office data entry exercise.

Compliance reporting eats real engineering capacity

Producing EPA reports, DWQMF evidence packs and internal QA submissions consumes weeks of engineering time every quarter. When the records live in three different systems and a filing cabinet, every report is a fresh exercise in chasing data, not analysing it.

From MapTrack's own data

What we see across MapTrack customer accounts

These figures come from MapTrack's own product data, de-identified and aggregated. Accounts aren't grouped by industry, so each figure covers every qualifying customer account, not one industry alone. Every figure counts at least 20 accounts, and each one says how it was measured.

15%

Scheduled services past their due date

Across 32 MapTrack customer accounts with service schedules, 15% of scheduled services were past their due date on 26 October 2026. More than three quarters of those (78%) were over 30 days past due.

Method: MapTrack's own product data: 32 customer accounts with service schedules, 5,855 scheduled services (884 past due), snapshot at 26 October 2026. Demo, test and trial-build accounts are left out. Includes schedules MapTrack set up during onboarding; the servicing itself is the customer's. One account holds 53% of the past-due services; without it the share is 16%. Some past-due items may be assets no longer in use that were never archived.
More than 80 days

How late a missed service runs

Across 32 MapTrack customer accounts, a service that was past due on 26 October 2026 was typically more than 80 days overdue.

Method: MapTrack's own product data: 32 customer accounts, 884 past-due services, snapshot at 26 October 2026. Demo, test and trial-build accounts are left out. Includes schedules MapTrack set up during onboarding; the servicing itself is the customer's. Typical means the median: 105 days across all past-due services and 82 days with the largest account left out, so the lower figure is used.

77%

Usual calendar service intervals

Across 37 MapTrack customer accounts with calendar-based service schedules, 6 months and 12 months are the usual intervals: together they cover 77% of calendar triggers.

Method: MapTrack's own product data: 37 customer accounts with calendar-based service schedules, 141 calendar triggers, schedules live on 26 October 2026. Demo, test and trial-build accounts and anything MapTrack staff created are left out. Counts: 6 months 55, 12 months 53, 3 months 18, monthly 7, other 8. This describes how customers set their own schedules, not what a regulation or standard requires.

Want to know what these costs look like on your own sites? Talk it through with us.

Book a demo

30 minutes on Microsoft Teams

Use cases

How water utilities use MapTrack

  • Asset numbering standard
  • Confined-space entry
  • Switchboard checks

Register the plant above ground, to your standard

Bring your asset list across from the spreadsheet, with the fields your naming standard needs marked required. Then label each pump, valve and switchboard, and a scan opens its record on the phone.

Asset register
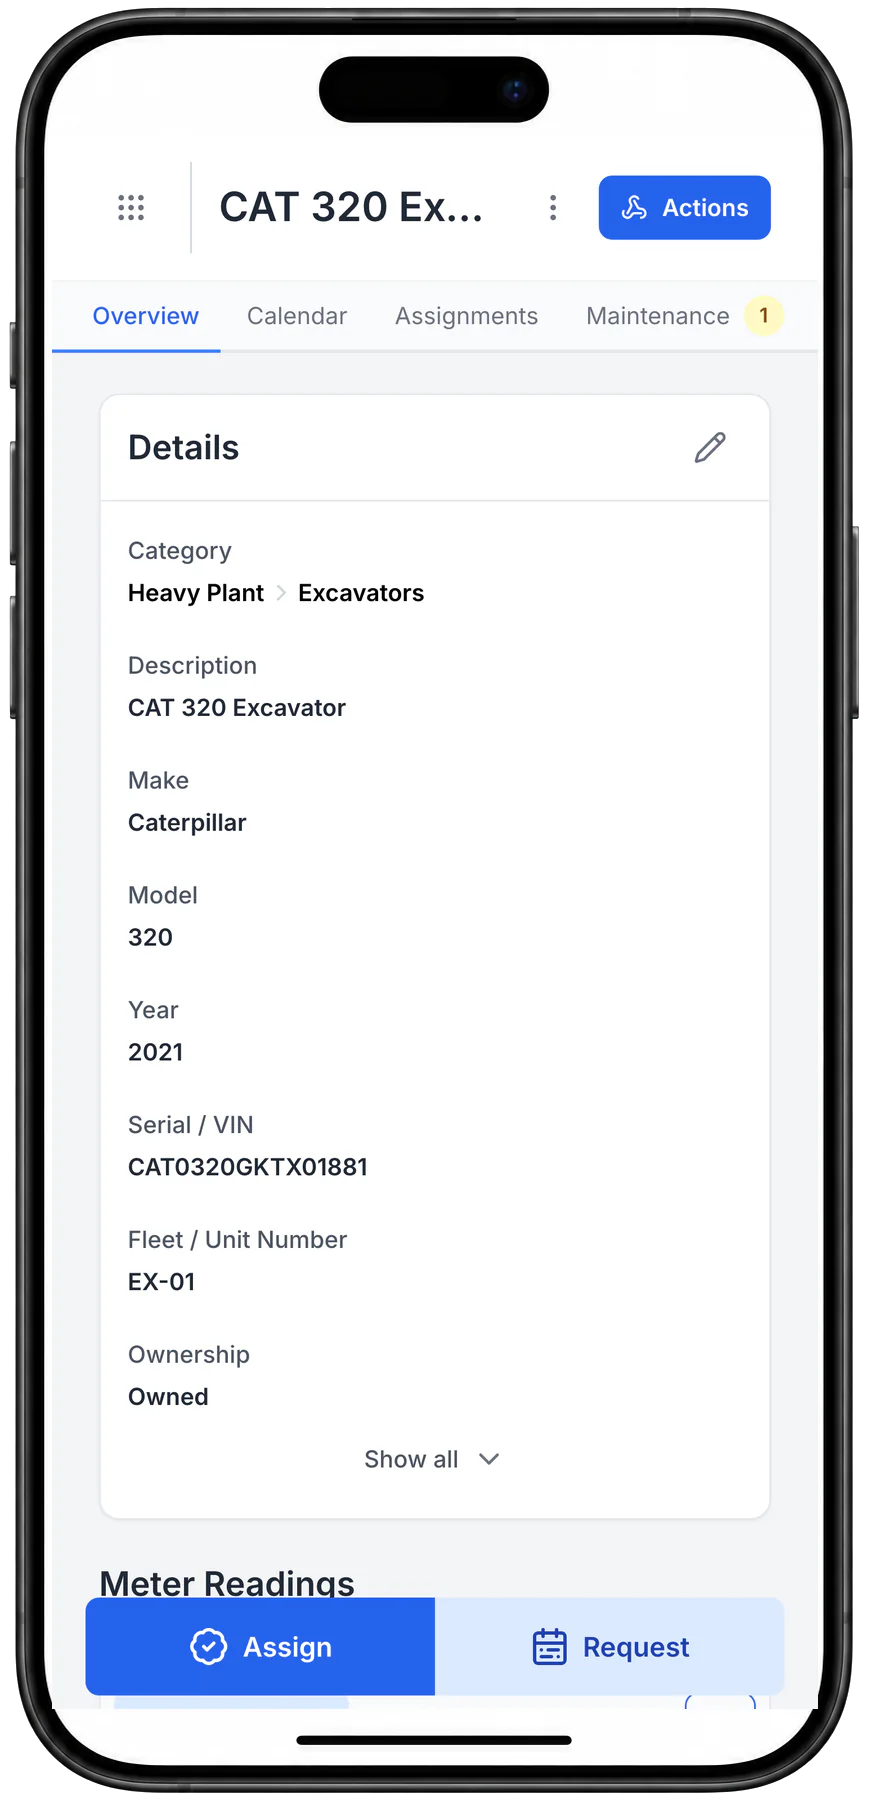
The MapTrack record for a CAT 320 excavator on a phone: category, description, make, model, year, serial, fleet number and ownership, with Assign and Request buttons.

Open the record a scan leads to

An asset record on a phone, with its details and Assign and Request one tap away. Scanning the asset’s MapTrack QR tag opens this record; this capture was opened from the asset list instead.

MapTrack app · Demonstration data · Captured

About this screenshot

Captured at a 430 x 932 phone viewport in a demonstration workspace and shown in a phone frame.

Lend mobile equipment, and know where it went

When a mobile generator or pump goes to another site, sign it out to the person or site taking it, with a due-back date. Anything overdue stands out, and its record shows who or which site has it.

Asset transfers
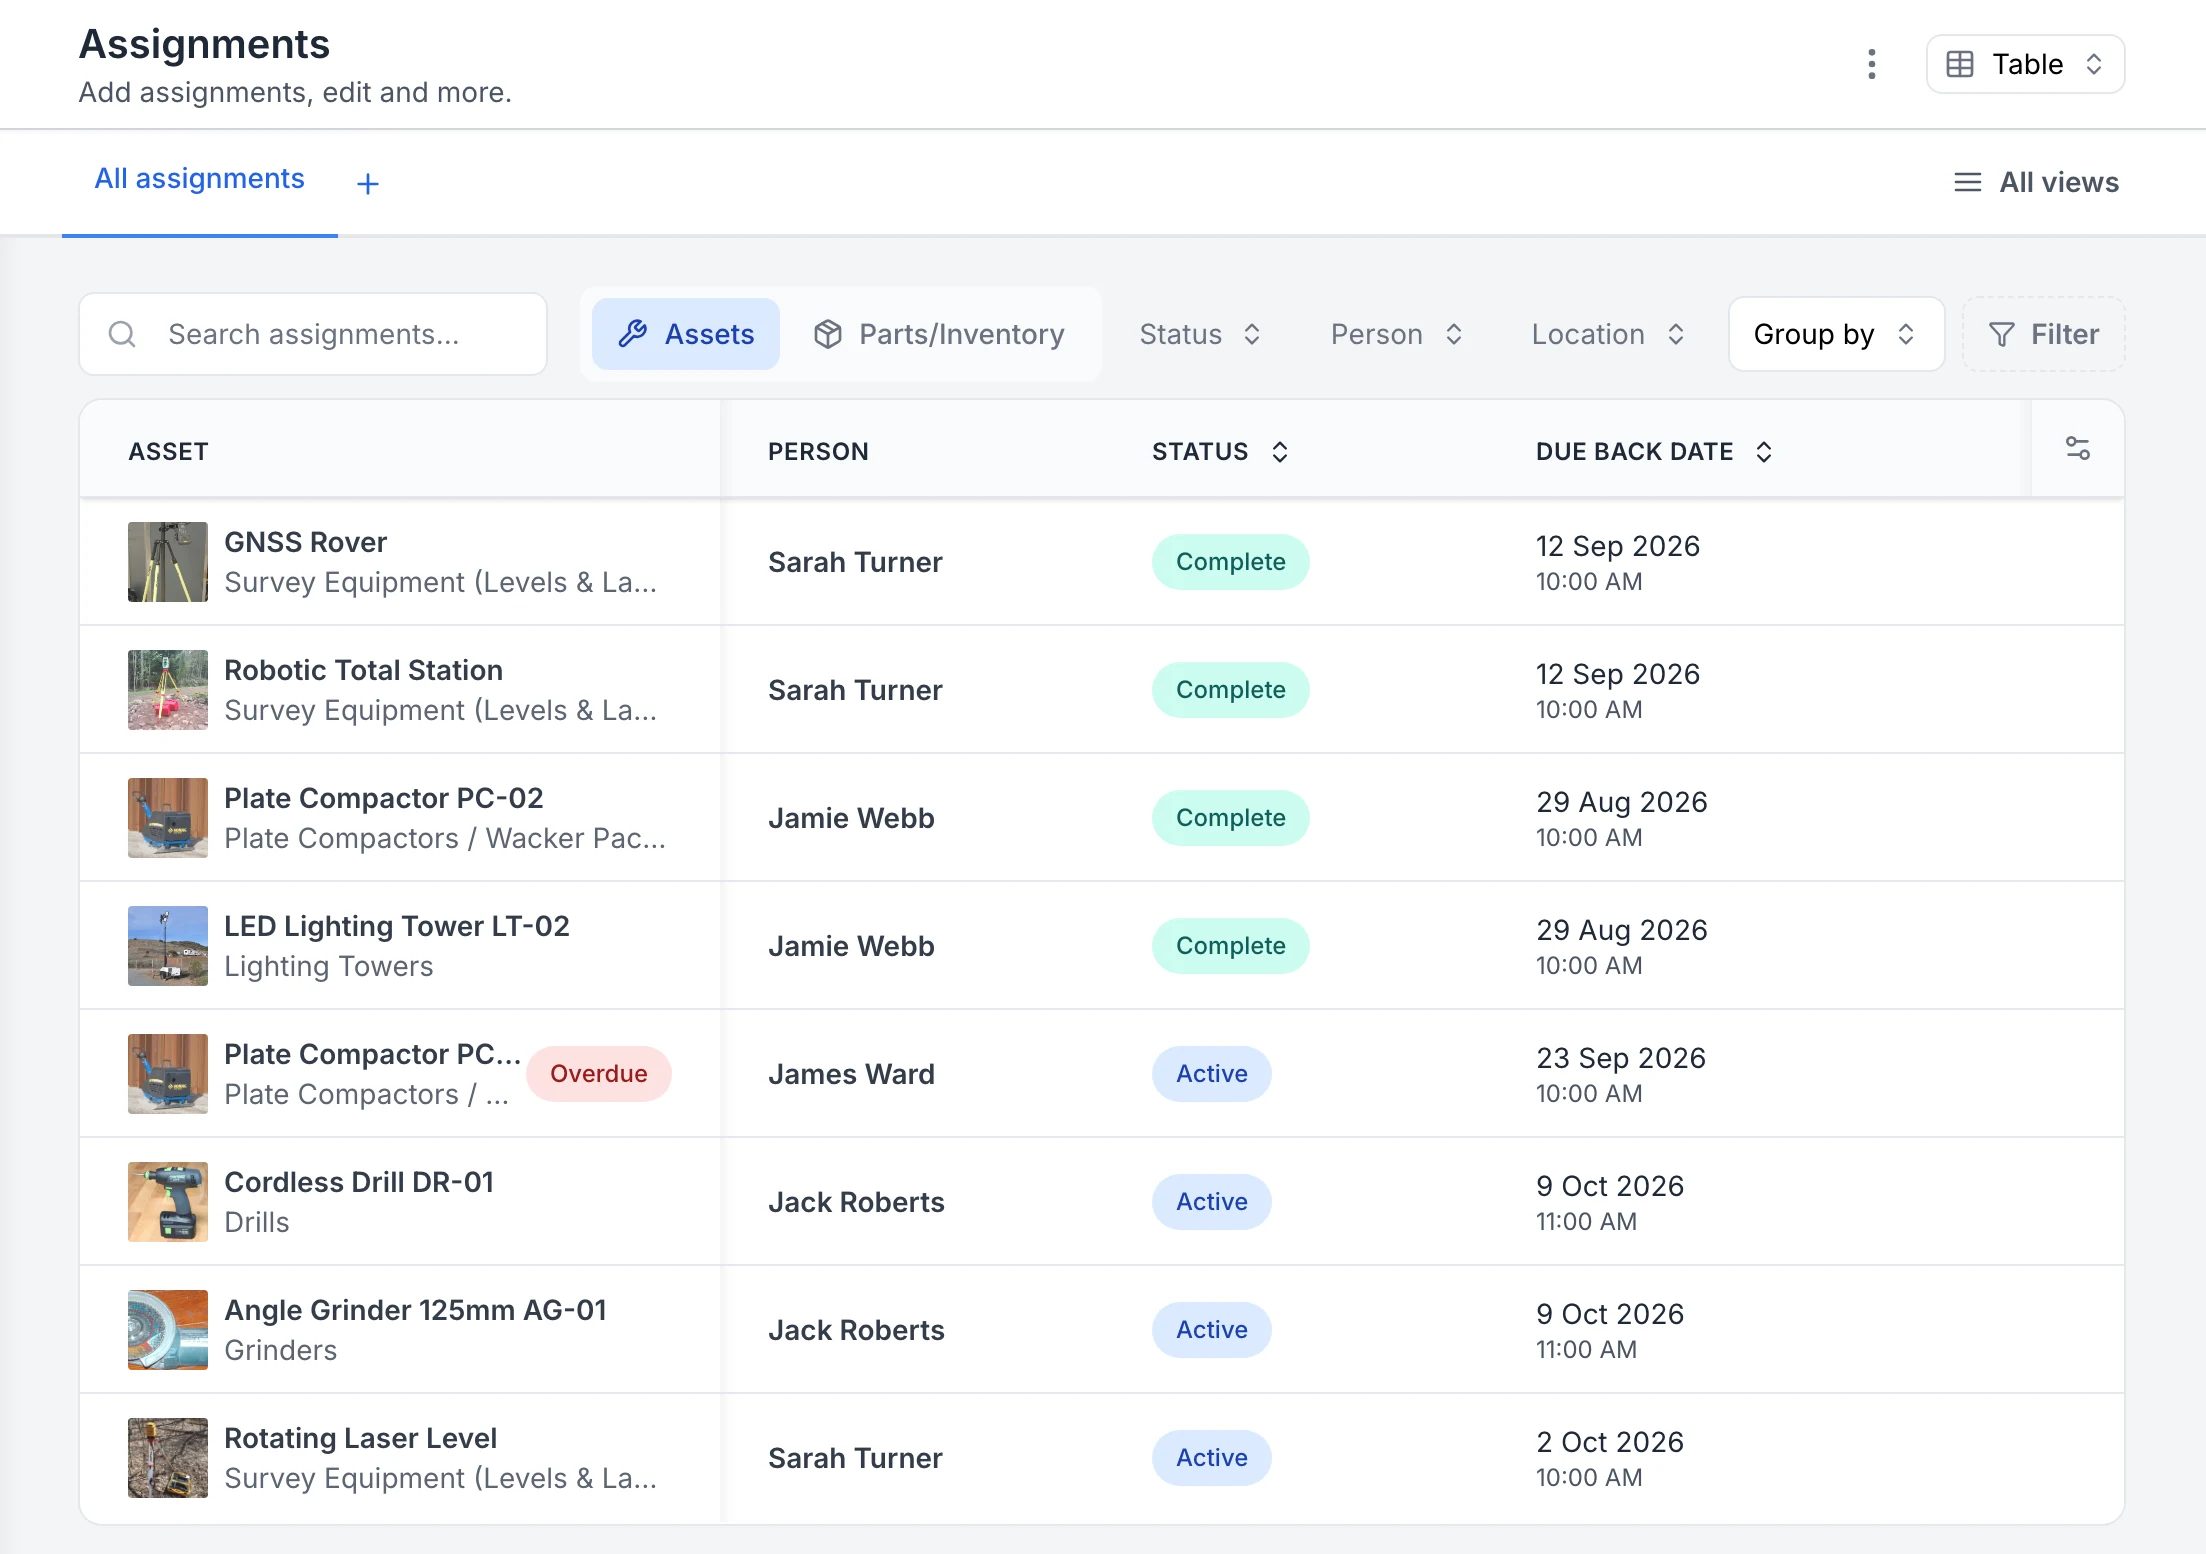
MapTrack Assignments table listing eight tool and equipment assignments, a GNSS rover, robotic total station, two plate compactors, a lighting tower, a cordless drill, an angle grinder and a rotating laser level, each with its photo, the person it went to, a Complete or Active status and a due-back date. One plate compactor is flagged Overdue.

See who has each tool and when it is due back

Every sign-out in one list. Four assignments are back and marked Complete; four are still out as Active, each with the person and the due-back date. The plate compactor with James Ward was due back on 23 September, so it is flagged Overdue.

MapTrack app · Demonstration data · Captured

About this screenshot

Captured in a demonstration workspace on the All assignments view with the Person, Status and Due Back Date columns. The app shortens long asset and category names.

Not sure which of these to start with? We'll walk you through it in a demo.

Book a demo

30 minutes on Microsoft Teams

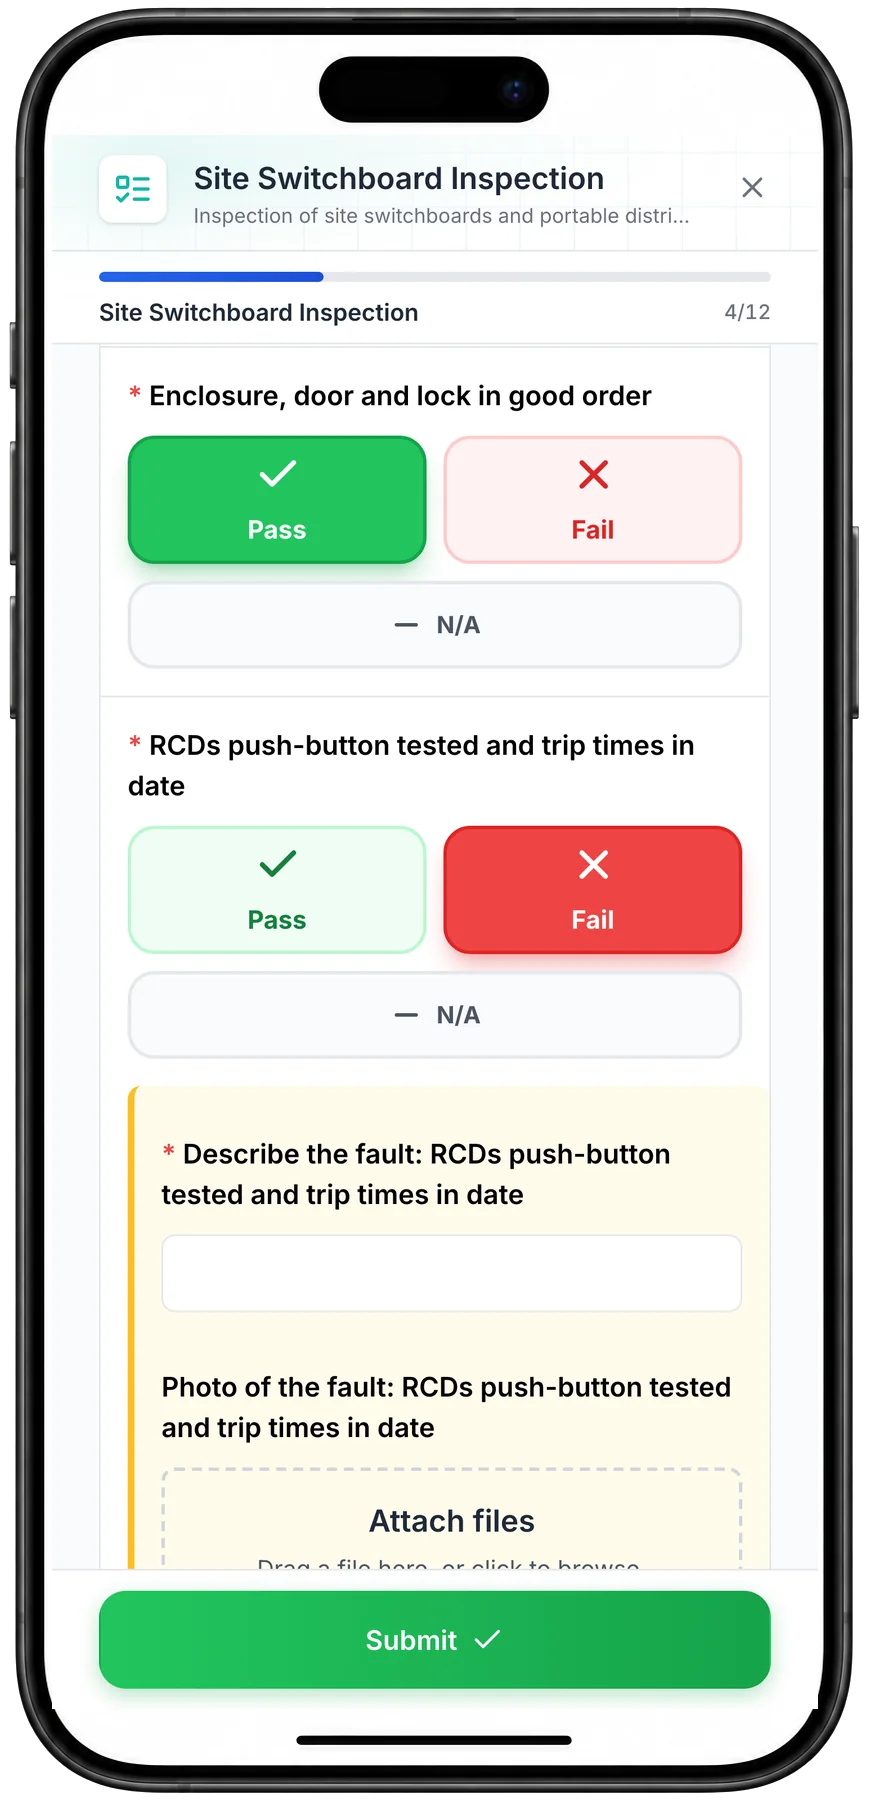
Switchboard checks with a photo of any fault

Check each pump station switchboard on the phone, with a pass or fail on every item. A fail opens the fault note and photo, so the fault's recorded with the check.

Forms and inspections
MapTrack Site Switchboard Inspection on a phone, progress 4 of 12: Pass selected for the enclosure, door and lock, Fail selected for the RCD push-button test and trip times, and the fault description and photo fields open below it, with Submit at the foot.

Fail a switchboard check on a phone

Choosing Fail on the RCD test opens the fault description and photo fields straight away, so the fault is recorded with the inspection.

MapTrack app · Demonstration data · Captured

About this screenshot

Captured at a 430 x 932 phone viewport in a demonstration workspace, with a connection, and shown in a phone frame. The form was closed without submitting.

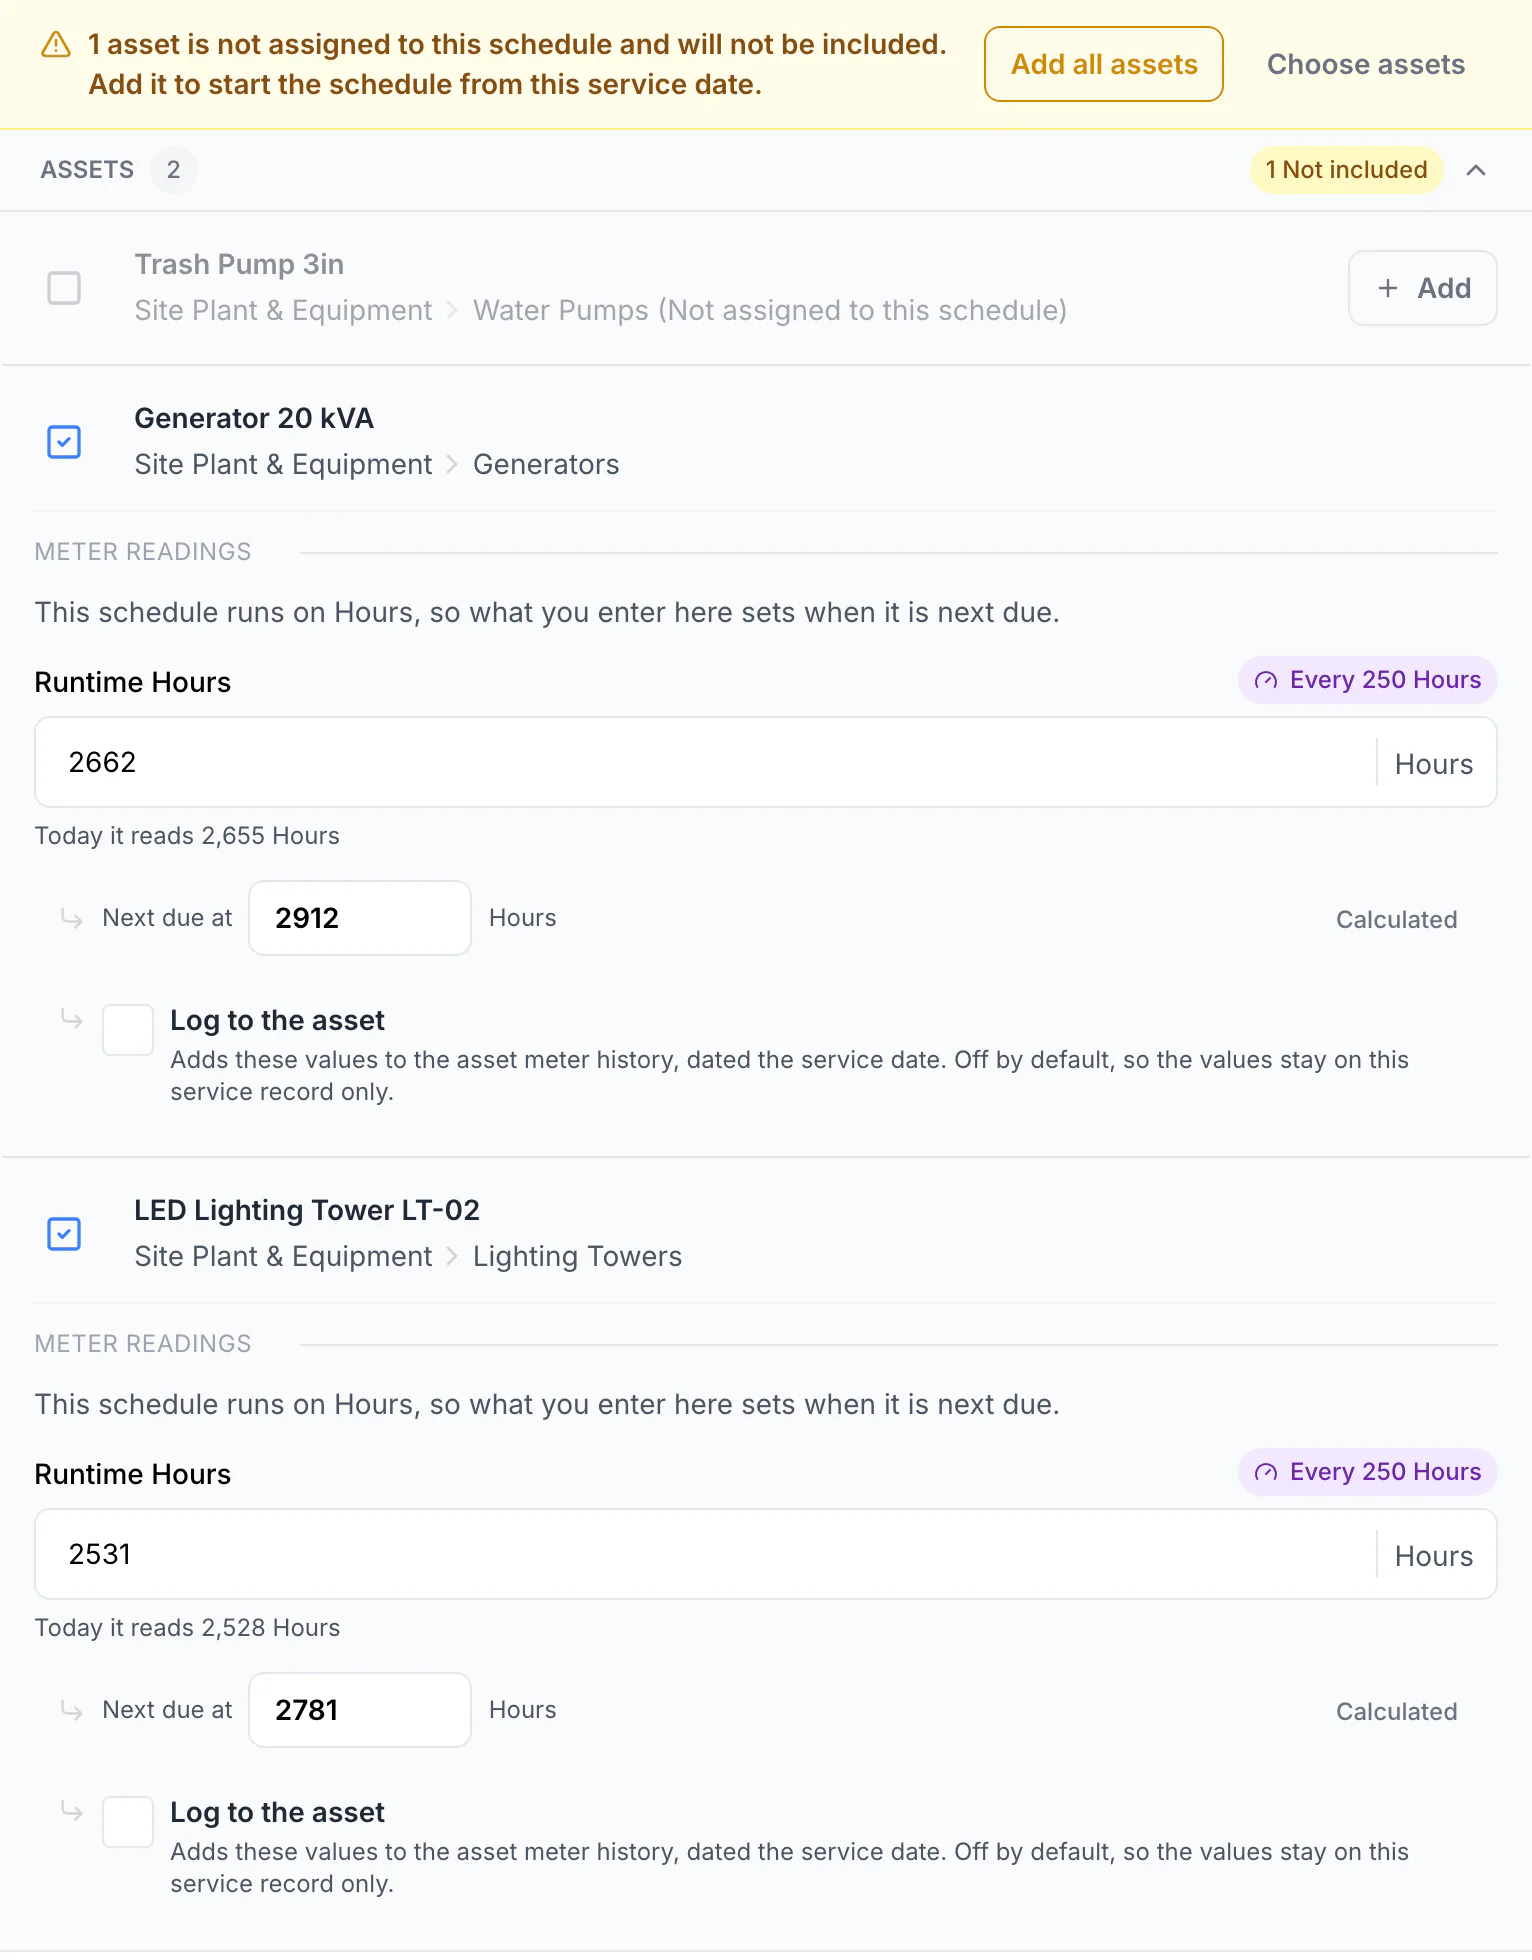
Generators and pumps serviced on run hours

Log the run hours when you service a generator or pump, and that reading sets when it's next due. Service several at once and each keeps its own reading.

Meter-based maintenance
MapTrack Log Service assets panel: a warning that 1 asset is not assigned to this schedule and will not be included, with Add all assets and Choose assets; the trash pump marked Not assigned to this schedule with an Add button; the generator with a runtime reading of 2662 hours, reading 2,655 today, next due at 2912; and the lighting tower with 2531 hours, reading 2,528 today, next due at 2781. Each has a Log to the asset option, off by default.

Enter each asset’s own reading

The schedule runs every 250 hours, so each reading sets that asset’s next due point: 2,662 hours gives 2,912 and 2,531 gives 2,781. The values stay on the service record unless Log to the asset is ticked, which adds them to the asset’s meter history. The trash pump is not on this schedule, so it is left out unless you add it.

MapTrack app · Demonstration data · Captured

About this screenshot

Demonstration workspace. The Log Service step for the two enrolled assets with readings typed in, before saving; the capture starts at the assets panel.

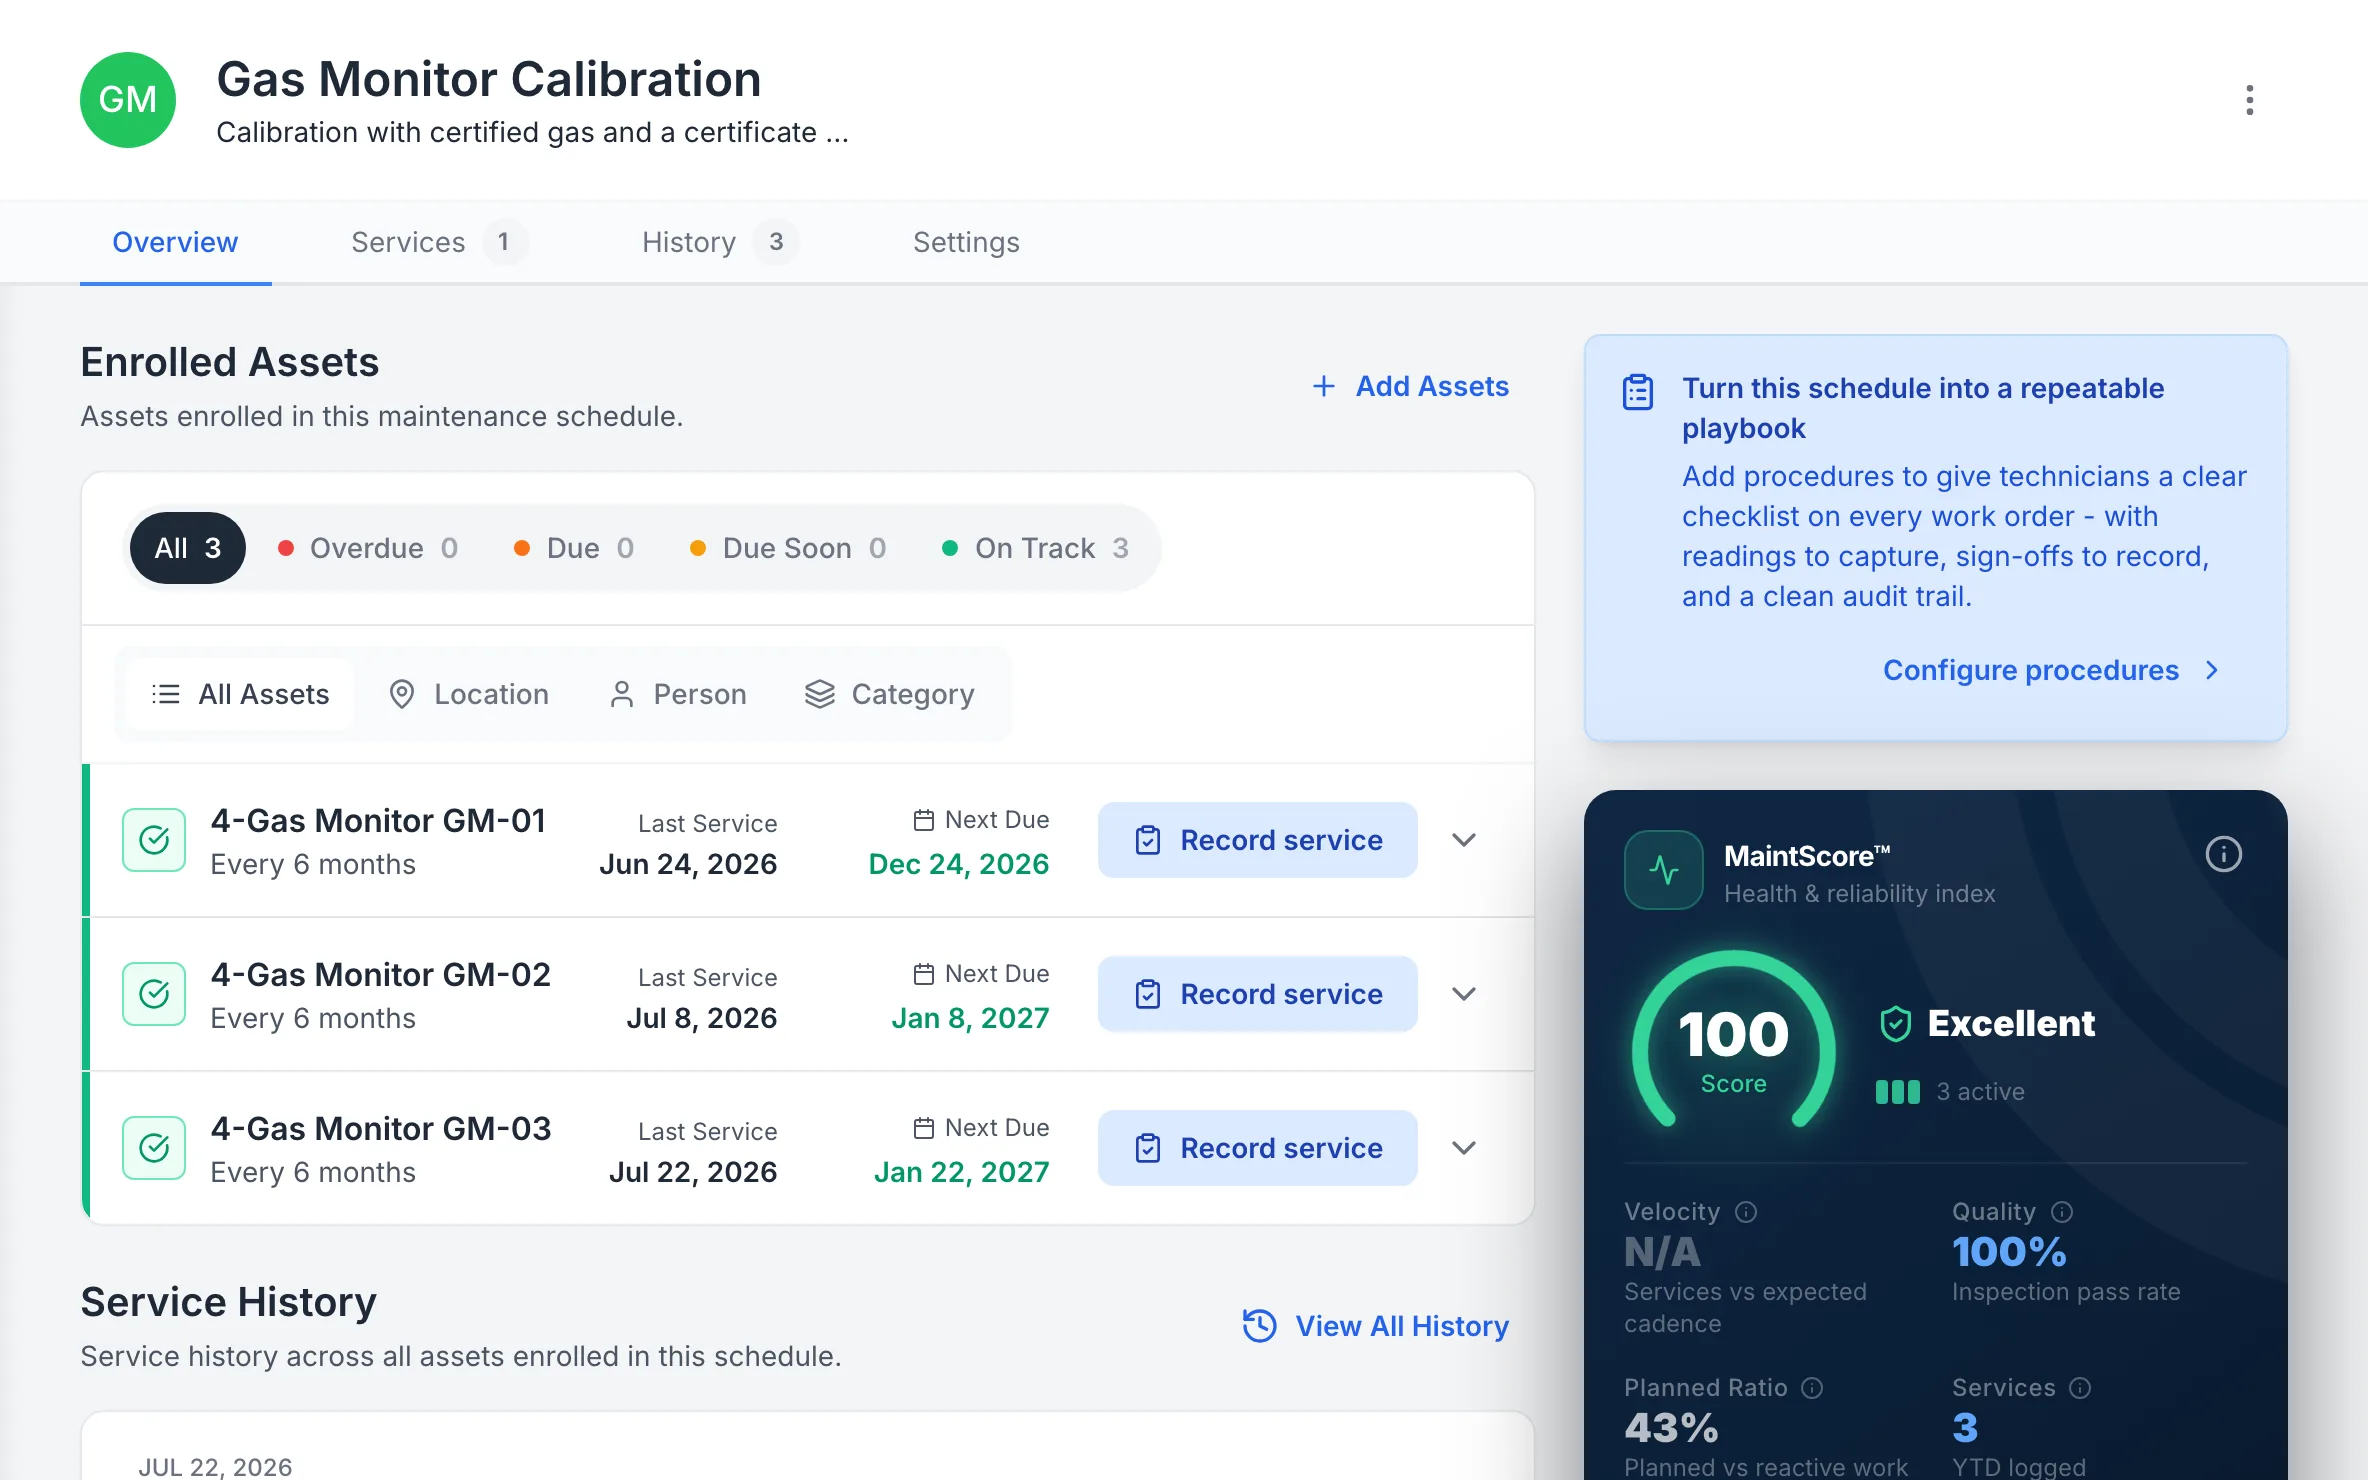
Gas detectors in cal for confined-space entry

Each gas detector sits on a calibration schedule with when it was last done and when it's next due, and anything overdue is flagged when someone goes to sign it out.

Compliance
MapTrack Gas Monitor Calibration schedule with 3 enrolled 4-gas monitors, GM-01, GM-02 and GM-03, all On Track, each calibrated every 6 months, last calibrated 24 June, 8 July and 22 July 2026 and next due 24 December 2026, 8 January and 22 January 2027.

Gas monitors on a calibration schedule

Each gas monitor on a six-monthly calibration schedule, with when it was last calibrated and when the next is due.

MapTrack app · Demonstration data · Captured

About this screenshot

Demonstration workspace at a 1440 x 900 desktop viewport, on the schedule’s Overview tab, cropped right of the navigation sidebar to a 16:10 frame.

Seen one that fits how your team works? We'll show it to you in a demo.

Book a demo

30 minutes on Microsoft Teams

Customer proof

What customers say

We haven't published a water utility customer story. The cards are customers doing the same work in other industries, and the first review below is from Utilities. Each is labelled with its own industry.

Gas distributor

“MapTrack's a great platform - intuitive for the guys out in the field and also has fantastic support.”

Matthew Anderson, Maintenance Planning Supervisor, SupagasReview on Capterra
Read the reviews on Capterra

“We are in the business of underground pipe remediation which involves underground CCTV drainage inspection, high pressure pipe cleaning, Ultra high pressure cutting, Robotic cutting, pipe relining and pipe defect patching to mention a few. ... Easy interface to navigate. Fantastic support from MapTrack.”

Lindsay, Workshop Coordinator, Utilities, 11-50 employeesVerified review on Capterra, August 2025

“MapTrack improves the visibility of asset availability and utilisation. MapTrack makes it easier to manage reservations , servicing and compliance requirements. It reduces the manual administration and is improving our record accuracy.”

Amberley, Plant and logistics Administrator, Civil Engineering, Mid-Market (51-1000 emp.)Verified review on G2, July 2026

Rated 4.9 on G2 (15 reviews) and 5.0 on Capterra, GetApp and Software Advice (one shared pool of 17 reviews). Capterra Best Ease of Use 2026 and Best Value 2026 badges. 600,000+ assets tracked since 2012. 24/7 support.

Want to hear how other water utilities teams set MapTrack up? Ask us in a demo.

Book a demo

30 minutes on Microsoft Teams

By the numbers

The real cost of poor asset management in water utilities

Water authorities operate critical infrastructure under strict regulatory expectations. Asset management gaps carry direct consequences for supply continuity, environmental compliance and customer trust. The numbers make a clear case for digital asset management.

A$349K

an hour: what unplanned downtime costs the typical Australian industrial business, against A$194,000 globally

ABB, Value of Reliability survey (2023)

69%

of industrial businesses surveyed experience an unplanned outage at least once a month

ABB, Value of Reliability survey (2023)

12–18%

savings from preventive over reactive maintenance, in the facility studies the US Department of Energy summarises

US Department of Energy, O&M Best Practices Guide, Release 3.0 (2010)

Want to see how these fit together on your own sites? We'll show you in a demo.

Book a demo

30 minutes on Microsoft Teams

Sampling & inspections

Mobile sampling and inspections from the field

Routine sample collection, reservoir inspections, valve exercising and dosing system checks completed in the MapTrack app on any phone. Failed items automatically raise work orders for the workshop or contractor. Compliance evidence captured at the point of work, with timestamps, GPS location and photos attached to each record.

  • AS/NZS 5667-aligned sample collection and chain-of-custody records
  • Failed items automatically trigger work orders to the workshop
  • Photos, GPS location and timestamps captured on every check
  • Works fully offline at remote pump stations and reservoirs
  • Build forms with AI or upload your existing inspection templates
Pre-start inspections
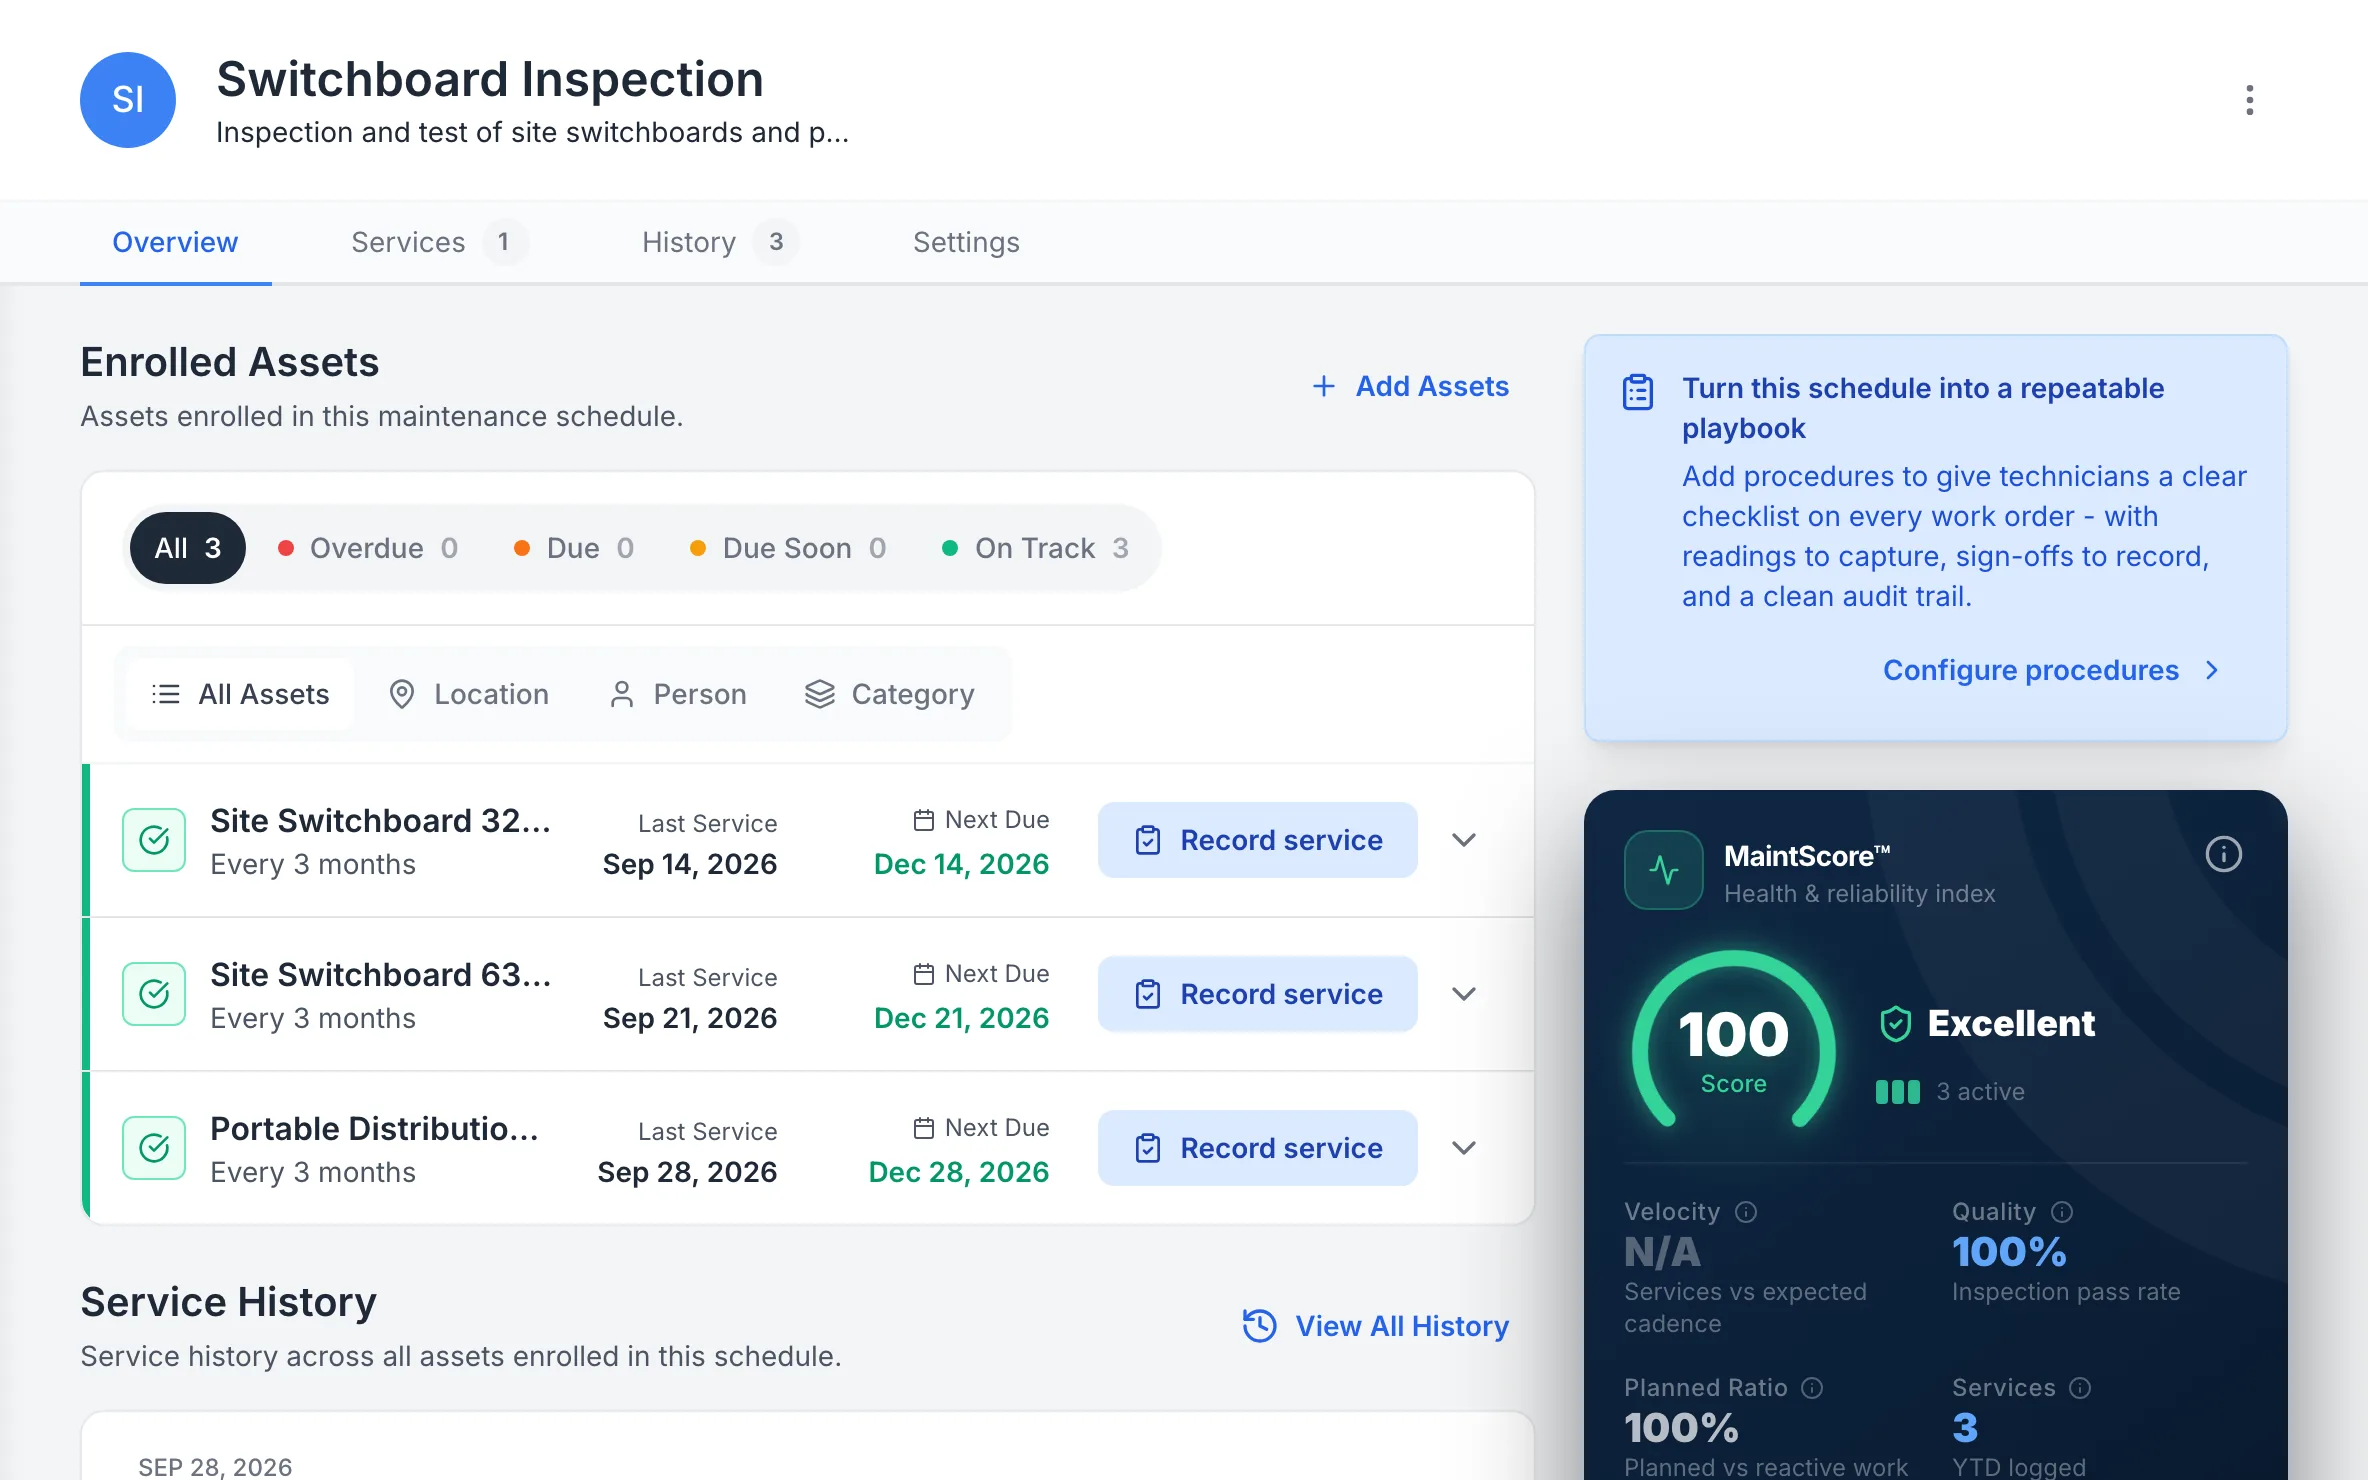
MapTrack Switchboard Inspection schedule with 3 enrolled assets, all On Track: Site Switchboard 32A, Site Switchboard 63A and a portable distribution board, each every 3 months, last serviced 14, 21 and 28 September 2026 and next due 14, 21 and 28 December 2026, beside a MaintScore of 100 and a 100% inspection pass rate.

Site switchboards on an inspection schedule

Each site switchboard and distribution board on a three-monthly inspection schedule, with when it was last inspected and when the next is due.

MapTrack app · Demonstration data · Captured

About this screenshot

Demonstration workspace at a 1440 x 900 desktop viewport, on the schedule’s Overview tab, cropped right of the navigation sidebar to a 16:10 frame.

Accountability

Scan, assign and audit across catchments

QR code every pump, valve, probe, dosing line and field tool. GPS track crew vehicles and high-value mobile equipment. Bulk scan during routine site visits, assign assets to crews (through a crew member or crew vehicle) or contractors, and run audits against expected on-site lists in minutes, not hours.

  • Check-in and check-out field instruments on mobile
  • Bulk scanning for routine site visits and asset audits
  • Assign assets to crews (through a crew member), contractors, plants or schemes
  • GPS location for crew vehicles and high-value mobile gear
  • Geofence alerts when assets leave a plant or boundary
Asset tracking
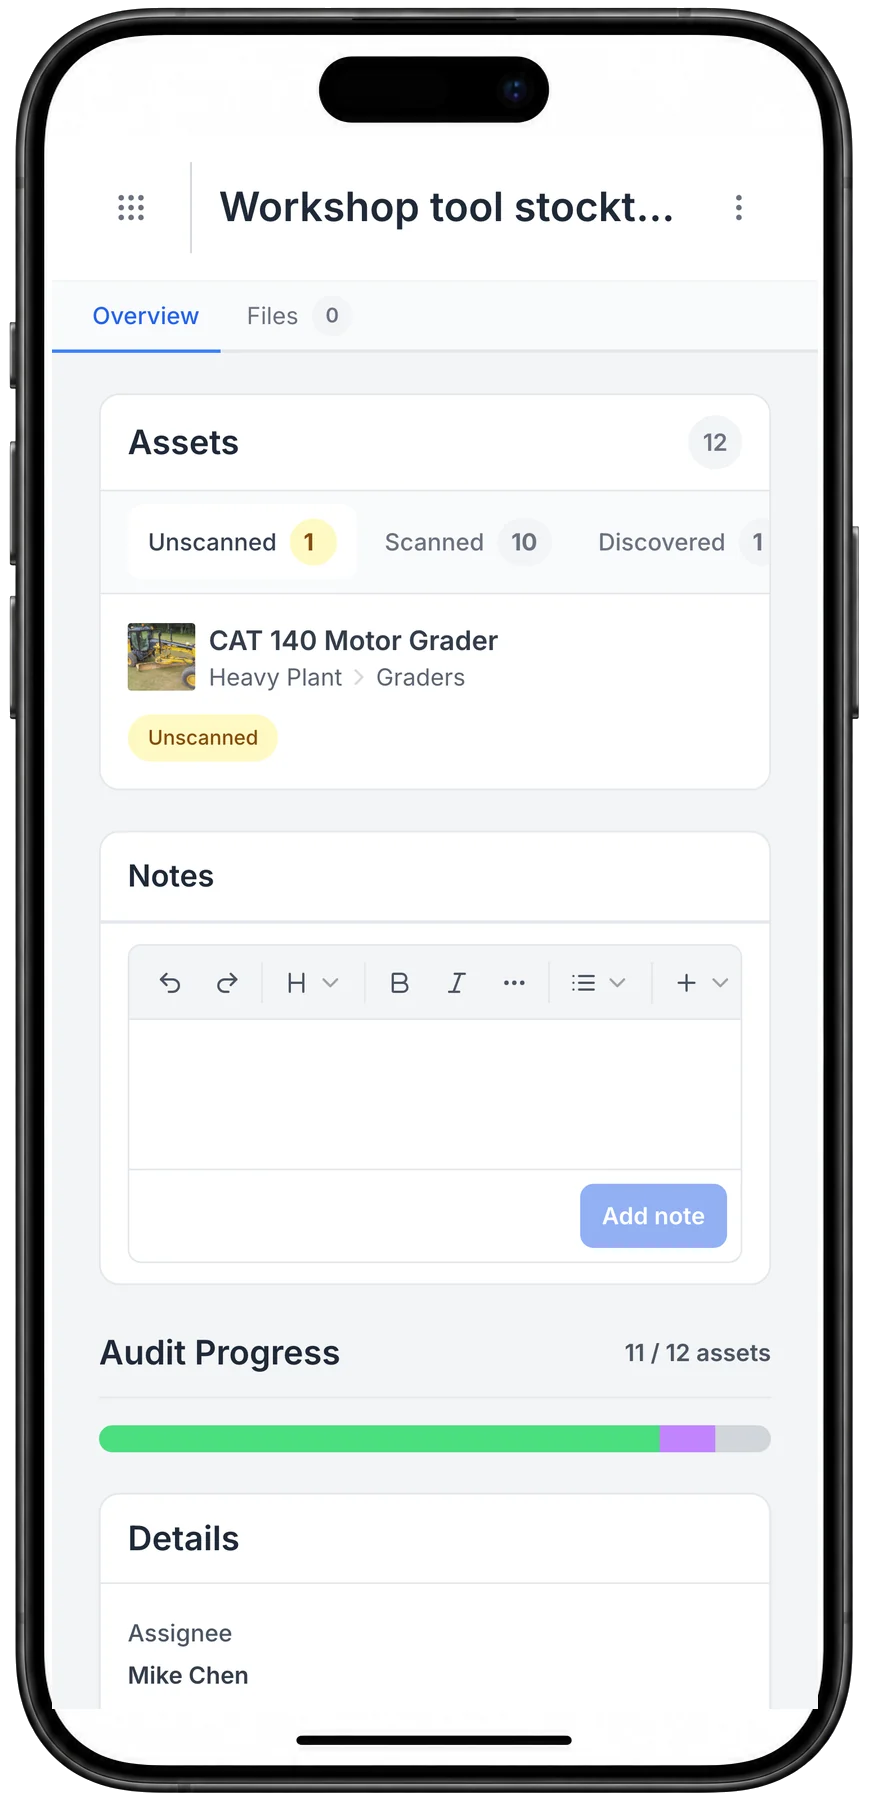
A MapTrack workshop tool stocktake on a phone: 12 assets, with 10 scanned, 1 discovered and 1 still unscanned, a CAT 140 motor grader, and audit progress at 11 of 12 assets, assigned to Mike Chen.

A stocktake on the phone

A stocktake on the phone: what has been scanned, what turned up that was not on the list, and what is still to find.

MapTrack app · Demonstration data · Captured

About this screenshot

Captured at a 430 x 932 phone viewport in a demonstration workspace and shown in a phone frame.

See these on a phone and a desktop in a live demo.

Book a demo

30 minutes on Microsoft Teams

Maintenance

Service pumps and plant when runtime says so

Trigger work orders from runtime hours, cycles and calendar combined, not arbitrary monthly reminders. OEM and telematics data feeds in automatically where integrated. Every service record lives alongside the asset tracking and compliance history, ready for the next EPA inspection or internal QA review.

  • Meter-based triggers: runtime hours, cycles, calendar combined
  • OEM and telematics data feeds in automatically where fitted
  • Work orders dispatched to workshop techs and contractors
  • Complete parts, labour and cost tracking by asset
  • Overdue alerts to prevent unplanned plant shutdowns
Maintenance & work orders
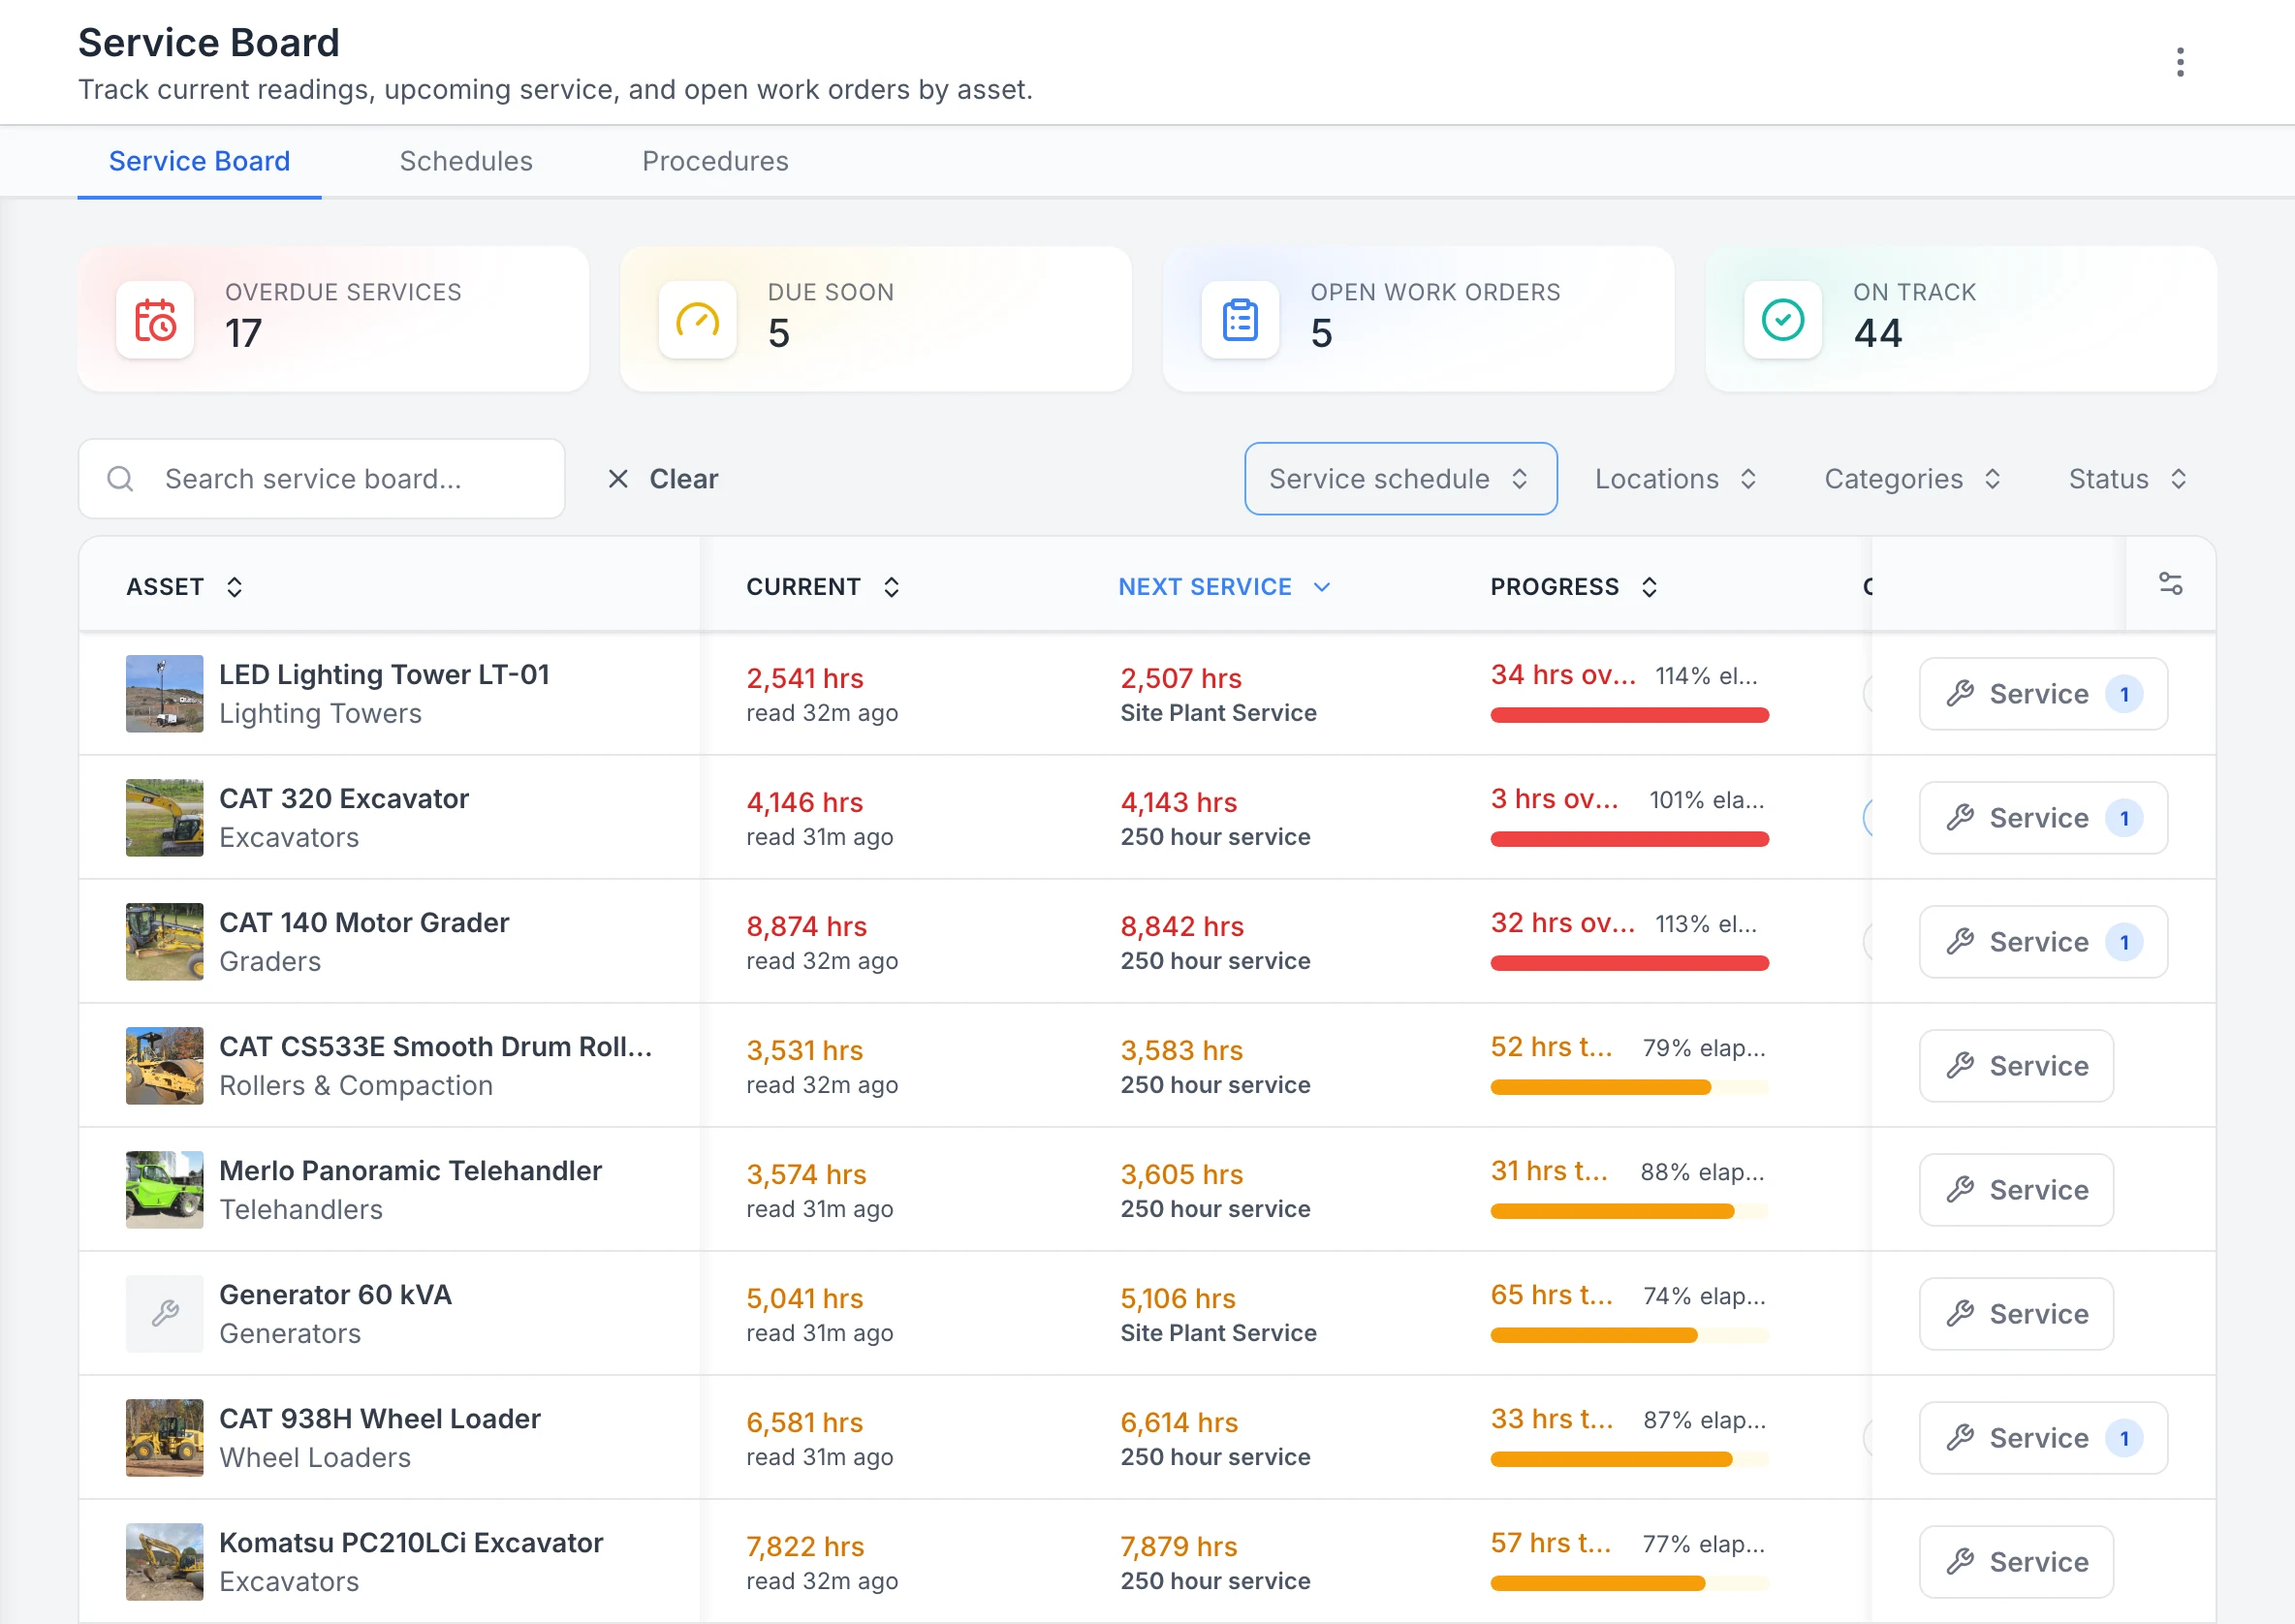
MapTrack Service Board filtered to the plant and site-plant service plans, counting 17 overdue services, 5 due soon, 5 open work orders and 44 on track. Rows: LED Lighting Tower LT-01 at 2,541 hours, 34 hours past its 2,507 hour site plant service; CAT 320 Excavator at 4,146 hours, 3 hours past its 4,143 hour 250 hour service; CAT 140 Motor Grader at 8,874 hours, 32 hours past its 8,842 hour service; then a smooth drum roller, a telehandler, a 60 kVA generator, a wheel loader and a Komatsu excavator with 31 to 65 hours to go, each read 31 or 32 minutes before the capture.

Plant and site gear by next service

Filtered to the plant and site-plant service plans and sorted by next service, the machines past their hour services come first: a lighting tower, the CAT 320 and a grader. Each row shows the current hour reading, the reading its next service falls due at and how far through the interval it is. The counts at the top cover the whole workspace, not only the filtered rows.

MapTrack app · Demonstration data · Captured

About this screenshot

Demonstration workspace at a 1440 px desktop viewport. The readings were entered by hand in the app that day. Filtered to two service plans with the board’s service schedule filter. Requires enrolled assets, configured schedules and an internet connection.

Integrations

OEM and telematics data, in one place

MapTrack integrates with the OEM and telematics platforms Australian water utilities already run, so runtime hours and GPS location drive maintenance and field crew utilisation automatically without manual data entry.

Caterpillar
Komatsu
Hitachi
John Deere
Teletrac Navman
Geotab
  • Runtime hour tracking for timely preventive servicing of pumps and generators
  • Live GPS location and geofence alerts for crew vehicles and mobile gear
  • Fault and diagnostic data where supported by your integration
  • Geofence-based time-on-site reporting for crew utilisation and contractor invoicing

See all integrations

Field-ready

Built for plants, pump stations and field crews

Water utility operations happen at remote pump stations and treatment plants, not the office. MapTrack runs on any phone or tablet with no specialist hardware required. Operators complete inspections, capture sample chain-of-custody and update meter readings directly from the field.

Offline mode means crews can keep working at remote reservoirs, bores and outlying pump stations with no signal, and data syncs automatically when back on coverage. Unlimited users means every operator, contractor, lab tech and compliance officer has access without per-seat fees.

Offline sync

Works at remote sites

QR scan

Any standard phone camera

Unlimited users

Every operator and contractor

Asset visibility across every plant, pump station and reservoir

Track pumps, dosing systems, valves and field instruments across distributed catchments. Sampling, calibration and AS/NZS-aligned evidence built for Australian water authorities.

  • Used across Australia & New Zealand
  • Per-asset pricing
  • Unlimited users

Get started

How water utilities get started

Most water authorities have their critical asset register imported, tagged and inspections running in MapTrack within days. Start with one treatment plant or scheme, then expand across the network.

Step 1

Import your critical asset register

Upload your existing asset list or start with a single treatment plant or scheme. Connect your telematics or OEM platforms so runtime hours and meter data feed in automatically.

Step 2

Tag and assign across plants and pump stations

Print durable QR labels for pumps, valves, probes, dosing lines and field tools. Organise assets by plant, scheme, region or catchment so each crew and engineer sees only what they need.

Step 3

Roll out inspections, schedule services, prove compliance

Operators complete inspections and sample collections on mobile from day one. Set runtime triggers for servicing. Calibration records, sampling evidence and inspection history captured automatically against each asset for EPA, DWQMF and internal QA reviews.

Compliance reporting time and unplanned plant downtime are the two biggest controllable costs in water utility asset management

MapTrack gives your operators and engineers the visibility, accountability and runtime triggers to cut both without adding headcount or replacing your SCADA platform.

The confined space and plant records water rules ask for

Water utilities in Australia, the United States and the United Kingdom answer to different rules, but the records they ask for look alike: what was checked, when, by whom, and what's due next. Open a market to see its rules, the words buyers there search for, and how pricing is quoted.

Australia

WHS Regulation ss 67 and 77

Prices on our pricing page are in Australian dollars, ex GST.

  • Australia, in Queensland's text of the model WHS Regulations (each state and territory enacts its own version)

    Work Health and Safety Regulation 2011, sections 67 and 77, confined space entry permits and records

    What it asks for

    No worker is directed into a confined space without a written entry permit, completed by a competent person, that names the space, the people allowed in, the work period and the risk controls. A copy of the risk assessment is kept until at least 28 days after the work is finished and the permit until the work is finished, or both for at least 2 years if a notifiable incident occurs.

    How MapTrack keeps the record

    MapTrack doesn't issue entry permits. It keeps the equipment side of the record: each gas detector's calibration date and certificate, and who had the confined-space kit and when it came back.

    Source: Work Health and Safety Regulation 2011 (Queensland) (Queensland Government (Queensland Legislation), checked 26 Oct 2026)

United States

OSHA 1910.146, OSHA 1910.147(c)(6)

Pricing is quoted in your currency, US dollars.

  • United States, general industry

    OSHA 29 CFR 1910.146, permit-required confined spaces

    What it asks for

    Before anyone enters, the atmosphere is tested with a calibrated direct-reading instrument for oxygen, then flammable gases and vapours, then toxic contaminants. In a space that can't be isolated, such as a sewer, testing is done as far as feasible before entry and conditions are monitored continuously while people are working.

    How MapTrack keeps the record

    Each gas detector is on the register with its calibration date, certificate and next due date, and booking one out past its due date is flagged and logged.

    Source: 29 CFR 1910.146, Permit-required confined spaces (US Occupational Safety and Health Administration, checked 26 Oct 2026)

  • United States, general industry

    OSHA 29 CFR 1910.147(c)(6), lockout/tagout periodic inspection

    What it asks for

    Each energy control procedure is inspected at least annually by an authorised employee other than the ones using it, to check the procedure is being followed and correct anything that isn't. The employer certifies each inspection, naming the machine or equipment, the date, the employees included and the person who did it.

    How MapTrack keeps the record

    The annual inspection of each pump station's procedure is a form on its record, naming the employees included and signed by the inspector.

    Source: 29 CFR 1910.147, The control of hazardous energy (lockout/tagout) (US Occupational Safety and Health Administration, checked 26 Oct 2026)

LOTO
Lockout/tagout: isolating a machine's energy sources and locking or tagging them out before servicing, under OSHA 29 CFR 1910.147, with each procedure inspected at least annually.

United Kingdom

Confined Spaces Regulations reg 5, PUWER regulation 6

Pricing is quoted in your currency, pounds sterling.

  • Great Britain, work in confined spaces

    Confined Spaces Regulations 1997, regulation 5, emergency arrangements

    What it asks for

    No one enters or works in a confined space unless suitable rescue arrangements have been prepared for it. Where someone could need resuscitation, the arrangements include providing and maintaining the equipment to do it, and they're put into operation straight away when needed.

    How MapTrack keeps the record

    MapTrack doesn't write rescue plans. It keeps each tripod, winch, harness and resuscitator with its inspection date and certificate, and who had the kit and when it came back.

    Source: Confined Spaces Regulations 1997, regulation 5 (legislation.gov.uk (The National Archives), checked 26 Oct 2026)

  • Great Britain, work equipment exposed to conditions that cause deterioration

    PUWER 1998, regulation 6, inspection

    What it asks for

    Equipment whose safety depends on how it's installed is inspected after installation and after assembly at a new site. Equipment exposed to conditions that cause deterioration is inspected at suitable intervals and after anything exceptional that could affect its safety. Each result is recorded and kept until the next one, and equipment going to another business carries evidence of its last inspection. Lifting equipment falls under LOLER instead.

    How MapTrack keeps the record

    Each pump, generator and vehicle has its own record, and inspection forms are signed and kept on it, with the next one showing as due soon or overdue.

    Source: Provision and Use of Work Equipment Regulations 1998 (PUWER), regulation 6 (legislation.gov.uk (The National Archives), checked 26 Oct 2026)

MapTrack keeps the records these rules ask you to keep. It does not do the inspection or testing, certify your work or make you compliant, and the current text of each instrument is the authority.

Want to see how these records would look for your own gear? We'll show you in a demo.

Book a demo

30 minutes on Microsoft Teams

Cut the reporting time

Compliance reporting and unplanned plant downtime are the two biggest controllable costs in water utility asset management

MapTrack gives your operators and engineers the visibility, accountability and runtime triggers to cut both without adding headcount or replacing your SCADA platform.

Frequently asked questions

Water utilities asset management software is a platform for water authorities, councils, treatment plant operators and distribution network teams to track, maintain and manage every pump station, dosing system, valve, meter, sample probe, generator, vehicle and field tool in one place. It replaces SCADA-only views, paper service logs and disconnected spreadsheets with a single source of truth for where each asset is, who is servicing it, what its compliance status is and when it is next due for inspection. MapTrack combines QR and GPS asset tracking, mobile inspections, sampling records, meter-based maintenance and audit-ready compliance evidence so plant operators, network crews and engineers all work from the same data.

Yes. MapTrack runs the routine sample collection, calibration and inspection forms that AS/NZS 5667 water sampling expects, with timestamps, GPS location and operator names captured at the point of work. Sample chain-of-custody records, calibration logs for field probes and test equipment, and EPA reporting evidence are all stored against the asset and exportable on demand. This is the same compliance posture state EPAs and the Drinking Water Quality Management Framework expect from Australian water authorities.

Yes. Distributed asset bases are exactly the problem MapTrack is built for. Each pump station, dosing site, reservoir, bore and treatment plant lives in the system as its own location with its own compliance register, maintenance history and assigned crew. GPS tracking for crew vehicles, geofence-based time-on-site reporting, and bulk QR scanning at each visit means leadership has a single network view across an entire catchment, even when assets are spread across hundreds of square kilometres.

Yes. MapTrack is built for field crews with full offline support. Operators can scan assets, complete inspections, record sample collections and update meter readings at remote pump stations, reservoir sites and isolated bores with no connectivity. Data syncs automatically when the device comes back into range. This is critical for regional water utilities where coverage is patchy across reservoirs, distribution corridors and outlying treatment sites.

Maintenance triggers in MapTrack run on runtime hours, cycles and calendar as required. Centrifugal pumps, dosing pumps, blowers and standby generators are serviced based on real runtime, not arbitrary monthly reminders. OEM and telematics integrations feed meter data automatically where they are fitted. Manual meter readings are also supported on assets without telematics, completed by the operator on the mobile app at the end of each visit. Failed inspection items raise work orders straight away so defects move from the field to the workshop without paper getting lost.

No. MapTrack sits alongside SCADA and your telemetry platform, not on top of it. SCADA handles the live process control and alarming, while MapTrack handles the asset register, compliance evidence, inspection records, work orders and field crew operations that pure SCADA platforms do not handle well. We can pull runtime hours and meter data through integrations to drive maintenance, but we will not interfere with the control layer keeping your network running.

Field probes, gas detectors, chlorine analysers and lab instruments all have mandatory calibration intervals. MapTrack stores calibration certificates, calibration history and next-due dates against each asset with alerts that trigger before instruments go out of calibration. Calibration records are searchable and exportable so you can produce evidence on demand for EPA inspections, internal QA reviews and customer audits. No more filing cabinets or scattered calibration spreadsheets.

Yes. Reservoir inspections, roof and hatch access checks, condition assessments, valve exercising and confined space entry permits are all configurable mobile forms in MapTrack. Each inspection lives against the asset with photos, location and operator name attached. Confined space permits, working at heights checks and lone-worker safety records are captured at the point of work, giving you a clean audit trail for safety regulators, internal HSE and external compliance reviews.

Assets are organised by region, catchment, treatment plant or scheme, with role-based access so each operator and engineer sees only what they are responsible for. Bulk scanning lets crews verify what is on each site during routine visits. Leadership can pull a single network view across every plant, pump station and reservoir for total asset status, compliance posture and overdue work, without manually consolidating spreadsheets from each region.

MapTrack uses per-asset pricing with unlimited users included. There is no per-seat licensing, so every operator, field crew member, engineer, contractor, lab tech and compliance officer can have an account without your costs growing as the team does. This matters for water authorities where contractor crews come and go for capital works, casuals back-fill during peak summer demand, and you need every operator completing forms on the mobile app from day one.

MapTrack's primary database and application hosting are in Sydney. Some supporting services may process data outside Australia, so water authorities should review the current subprocessor list and hosting documentation against their own requirements. RBAC and SSO support enterprise rollouts where IT security, network segregation and access control are mandatory.

The best asset management solution for water utilities combines QR and GPS tracking with mobile inspections, sampling chain-of-custody, calibration records and runtime-based maintenance in a single platform. It needs to work offline at remote pump stations, sit alongside SCADA without replacing it, handle distributed asset bases across catchments, and produce audit-ready evidence for AS/NZS 5667 sampling, EPA reporting and the Drinking Water Quality Management Framework. MapTrack is set up for these requirements with per-asset pricing, unlimited operator and contractor logins, and Australian-built support.

Give every pump station a location in MapTrack and every pump, switchboard and generator there its own record. Crews scan the item, run the inspection on the phone and the result saves against it, with any fault photo and the fix beside it. Services fall due on run hours or a date, and each item's history stays with it rather than in a folder at the depot.

Yes. Bring your asset list across from the spreadsheet with your asset numbers, and mark the fields your naming standard needs as required, so every new record follows it. Nest each site into zones, like a treatment plant's buildings or a pump station's switch room, and label each item with a QR code that opens its record.

Got a question we haven't answered here? Ask it in a demo.

Book a demo

30 minutes on Microsoft Teams

Get MapTrack pricing for Water Utilities teams

Tell us about your operations. Our team will share per-asset pricing tailored to your water utilities asset mix and a rollout plan - within one business day.

Per-asset pricing. Unlimited users. Primary database hosted in Sydney.

Total visibility across the catchment, in one platform

Join Australian water authorities, councils and treatment plant operators using MapTrack to track distributed assets, run digital inspections, and keep audit-ready compliance evidence on tap.

Pre-start inspections · Maintenance · Asset tracking · Energy & utilities · Compare

Tools from $1 · Machines from $12View pricing